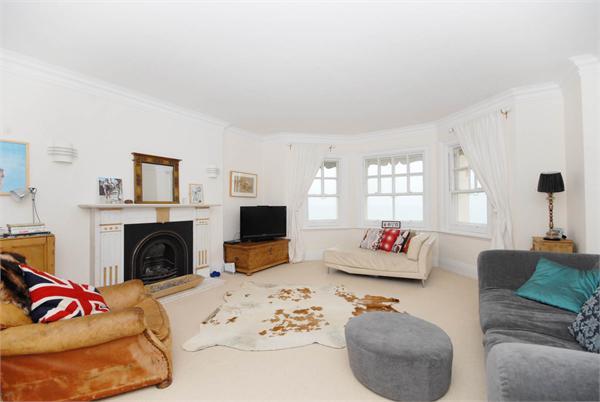
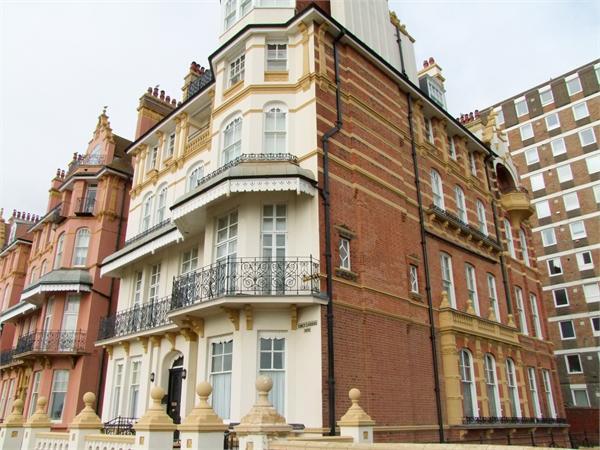
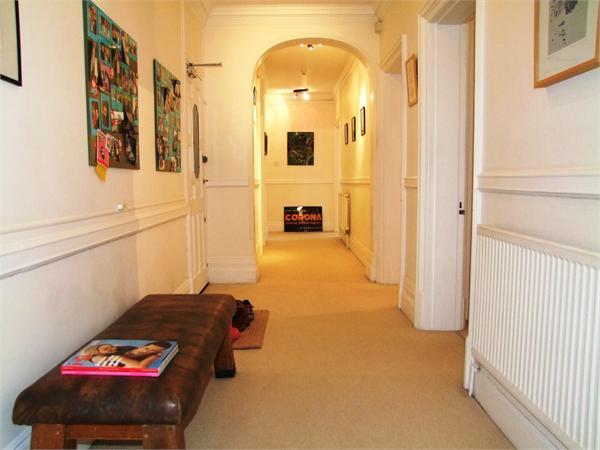
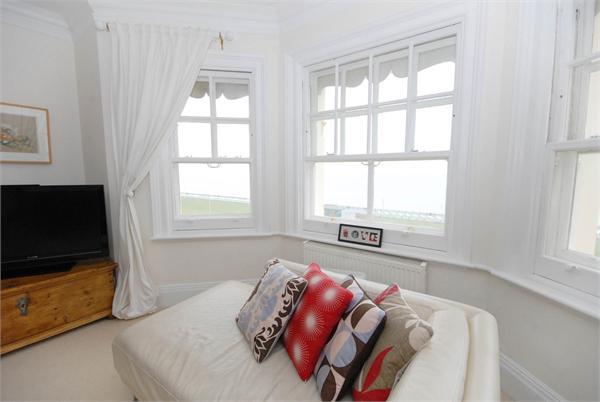
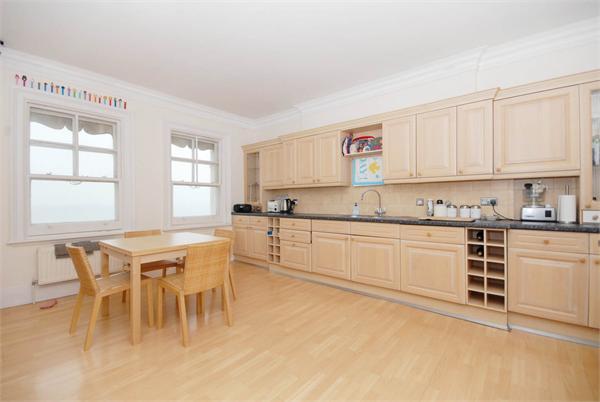
FLAT 1
3 KINGS GARDENS, HOVE, BRIGHTON AND HOVE BN3 2PE
£750,000
Property details
Floor area
146 m²
Last sold
£930,000 Jul 2014
Local average
£423,846 (+77%)
Deprivation
Decile 7 (20,533 of 33,755)
Street crime
534 incidents within 1 mile (Apr 2026)
Key features
- Amenities:Entrance Phone,Passenger Lift,
- Near Stations:Hove,
Description
Listed by
Brighton & Hove
Winkworth
Reference: 14584770
EPC Rating & Upgrade Cost
Fetching EPC data… Refresh this page in a moment.
Flood risk
Zone: 1
Risk: Low
Job (default Low)
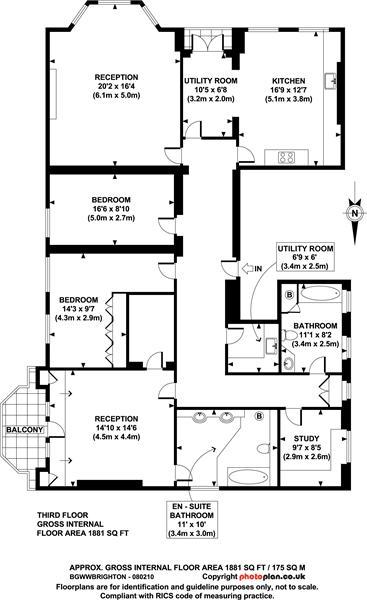
Floorplans
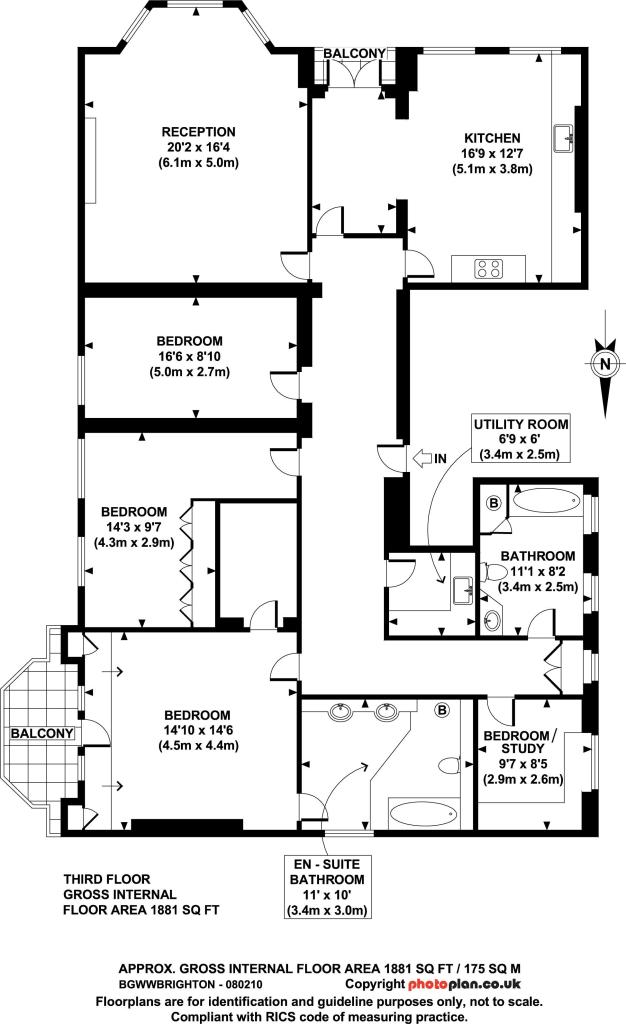
Floorplan
EPC Graphs

EPC
Price history
365% since 1999
| Event | Date | Price | % change |
|---|---|---|---|
| Sold | 18/07/2014 (11 years ago) | £930,000 | +57.6% |
| Sold | 25/03/2013 (13 years ago) | £590,000 | +195.1% |
| Sold | 16/08/1999 (26 years ago) | £199,950 | — |
Source: HM Land Registry Price Paid Data. Crown copyright.
Sold Comparables
Same street and nearby sales within 0.25 miles (last 5 years). Data from Land Registry Price Paid.
| Address | Price | Date | Type |
|---|---|---|---|
| KINGS HOUSE PARKING SPACE 76 GRAND AVENUE, HOVE, BRIGHTON AND HOVE, BN3 2LS | £40,000 | 10/11/2023 | Other |
| KINGS HOUSE PARKING SPACE 74 GRAND AVENUE, HOVE, BRIGHTON AND HOVE, BN3 2LS | £36,365 | 31/03/2023 | Other |
| KINGS HOUSE, 8 FLAT 33 QUEENS GARDENS, HOVE, BRIGHTON AND HOVE, BN3 2QU | £680,000 | 20/12/2022 | Other |
| 15 THIRD AVENUE, HOVE, BRIGHTON AND HOVE, BN3 2PB | £1,400,000 | 18/08/2022 | Other |
| KINGS HOUSE, 8 FLAT 31 QUEENS GARDENS, HOVE, BRIGHTON AND HOVE, BN3 2QU | £765,000 | 15/02/2022 | Other |
Area average: £584,273 (5 sales)
Capital growth trend
Land Registry outcode average: last 12 months vs 5y and 10y ago (from sold prices).
House Price Index (HM Land Registry — official index, not sold-price averages): Brighton and Hove. Series: All dwelling types. As of March 2026.
Rental Range
Estimated market rent for Brighton and Hove. Low = conservative, Realistic = average, Optimistic = best case.
Based on Local Authority from postcode lookup → Brighton and Hove.
LHA (30th percentile) floor for Brighton and Hove: £1,995/mo (Apr 2025 – Mar 2026)
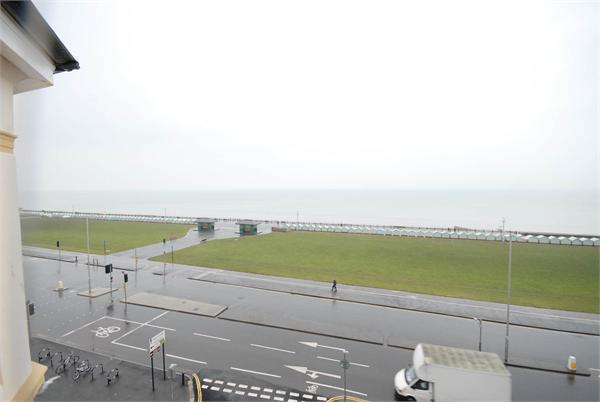
Location
Nearby
Nearest stations, universities and amenities (distance from property).
| Type | Name | Distance |
|---|---|---|
| Bus stop | Unknown | 0.1 miles |
| Bus stop | Fourth Avenue | 0.1 miles |
| Shop | Velvet | 0.2 miles |
| Shop | Nick Rivett Sport | 0.2 miles |
| Hospital | Aldrington House | 0.7 miles |
| Train station | Hove | 0.7 miles |
| Hospital | The Montefiore Hospital | 0.8 miles |
| Train station | Aldrington | 0.9 miles |
| University | University of Brighton Phoenix Halls | 1.7 miles |
| University | Silverstone SB309 Lecture Theatre | 4.6 miles |
Street-level crime
| Category | Count |
|---|---|
| Violence and sexual offences | 138 |
| Anti-social behaviour | 137 |
| Shoplifting | 60 |
| Public order | 54 |
| Other theft | 33 |
| Criminal damage and arson | 24 |
| Other crime | 24 |
| Vehicle crime | 18 |
| Drugs | 16 |
| Burglary | 10 |
| Bicycle theft | 9 |
| Possession of weapons | 7 |
| Robbery | 3 |
| Theft from the person | 1 |
| Total incidents | 534 |
Within 1 mile during Apr 2026. Source: data.police.uk (England & Wales).
Schools nearby
Nearest open schools with Ofsted ratings (England). Closed schools are not shown. Data from Get Information about Schools and Ofsted.
| Name | Type | Distance | Ofsted |
|---|---|---|---|
| St Andrew's CofE (Aided) Primary School | Primary | 0.4 miles | Good — 20 Apr 2015 |
| Brighton and Hove Clinic School | Other | 0.5 miles | Outstanding — 18 Jun 2024 |
| Brunswick Primary School | Primary | 0.6 miles | Requires improvement — 11 Jul 2024 |
| The Montessori Place | Other | 0.6 miles | Outstanding — 28 Sep 2022 |
| South England International School | Other | 0.7 miles | Good — 2 May 2023 |
Rental Comparables
Rental listings exist nearby, but none matched the 4-bedroom count for this property.
Rent-driven metrics
Based on Area rent estimate.
- Rent ratio — Monthly rent ÷ purchase price (1% rule). 1%+ = strong, 0.8–1% = okay, <0.8% = weak for cashflow.
- Max investor price — Rent ÷ 0.8%; the price at which rent would be 0.8% of price (Stoke-style target).
- Target investor price — Rent ÷ 1%; the price at which rent would be 1% of price (strong cashflow band).
- Gross yield — Annual rent as % of purchase price (no costs).