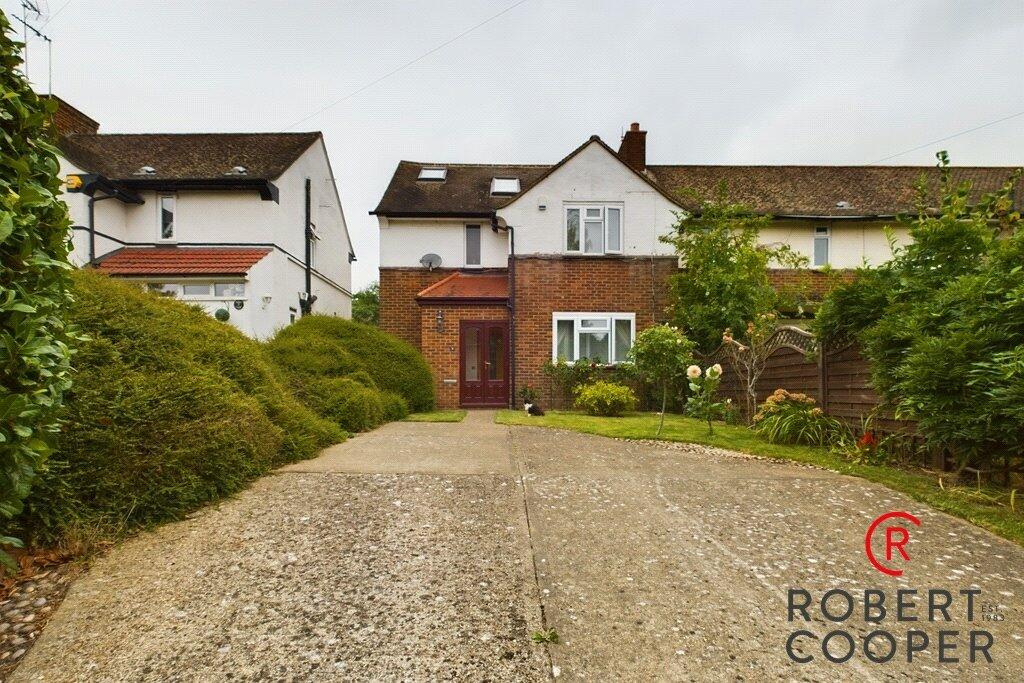
9 MALMESBURY CLOSE
PINNER, GREATER LONDON HA5 2NG

Property details
Tenure
FREEHOLD
Floor area
132 m²
Council tax band
TBC
EPC rating
D
Year built
England and Wales: 1950-1966
Last sold
£678,000 Jun 2025
Price per m²
£4,924/m²
Local average
£609,591 (+6.6%)
Deprivation
Decile 5 (15,809 of 33,755)
Street crime
115 incidents within 1 mile (Apr 2026)
Key features
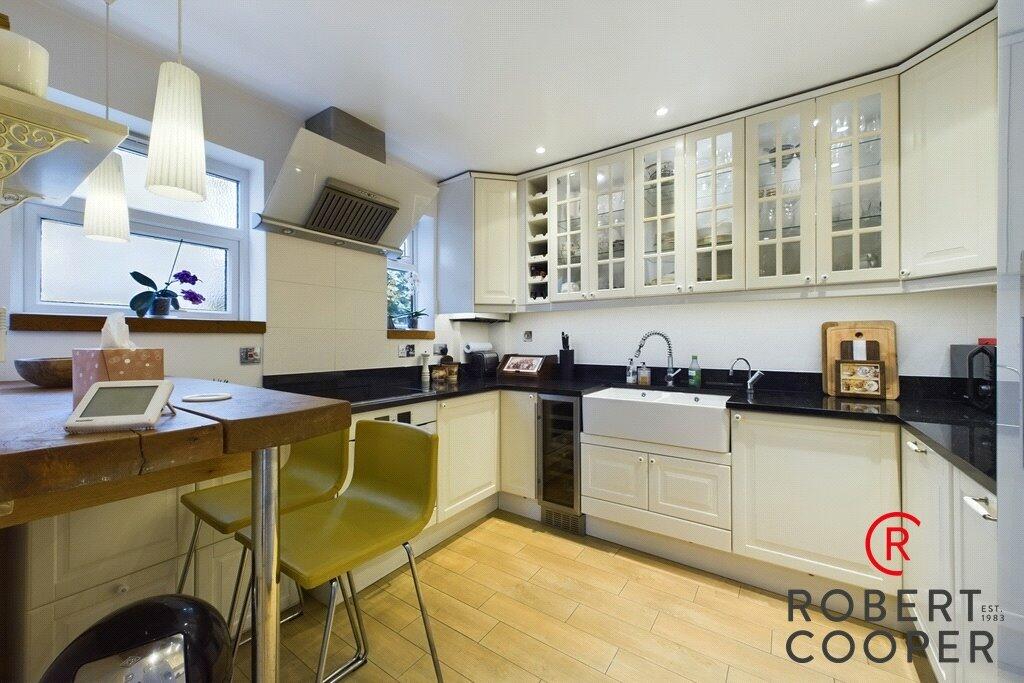
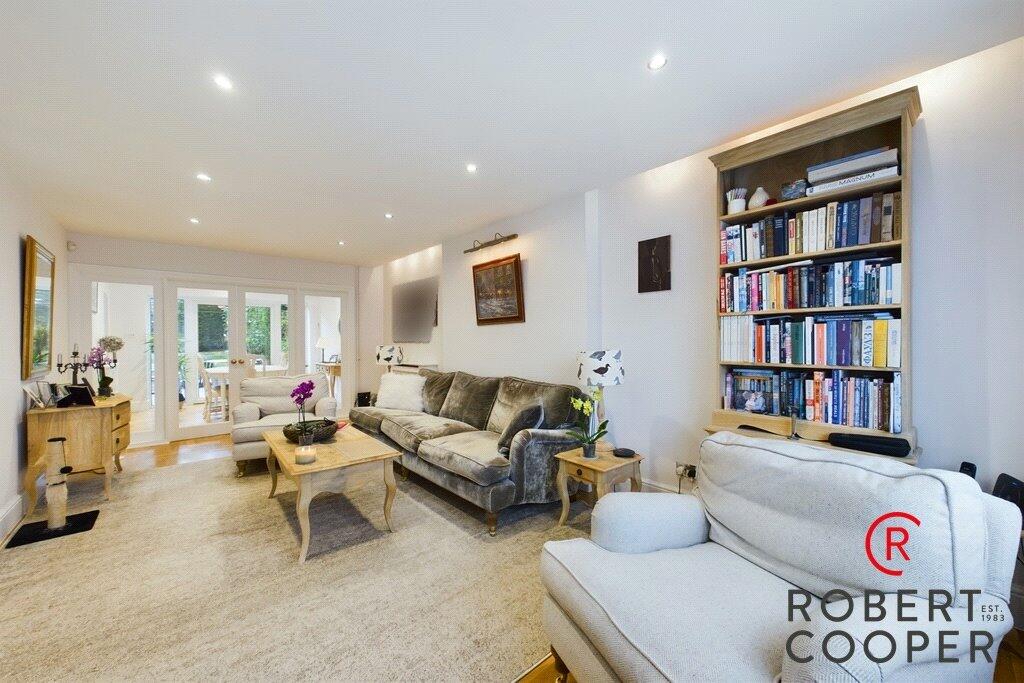
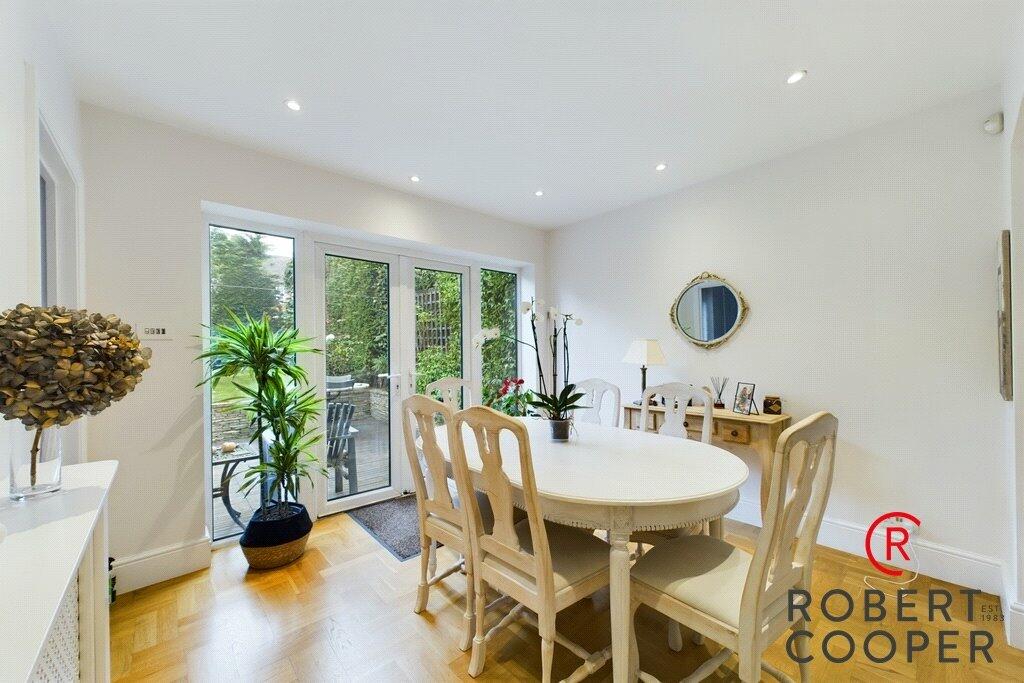
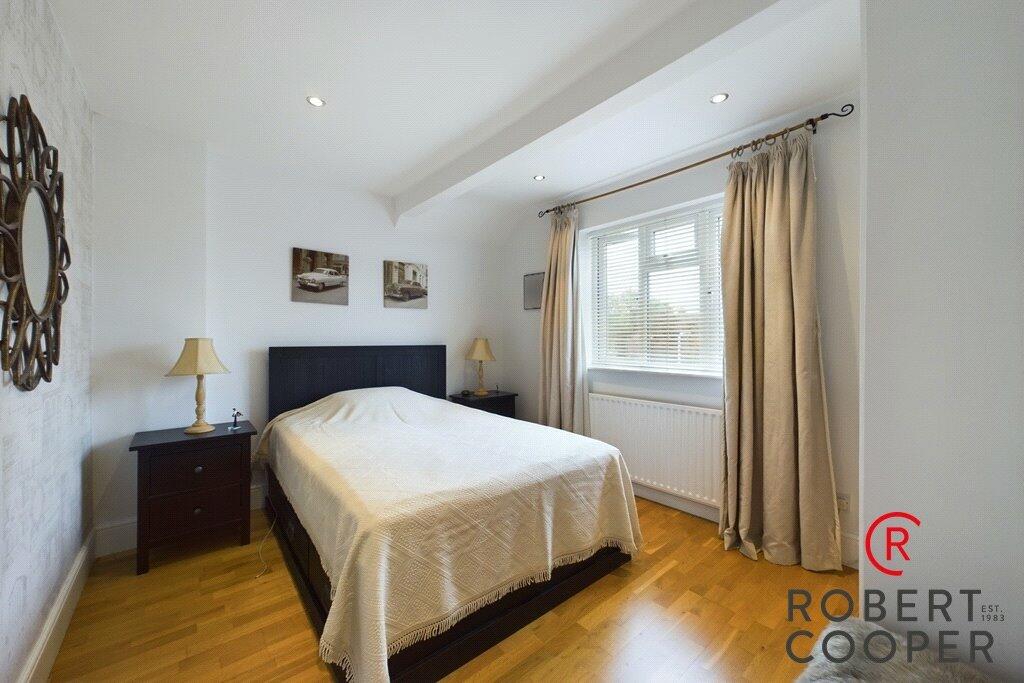
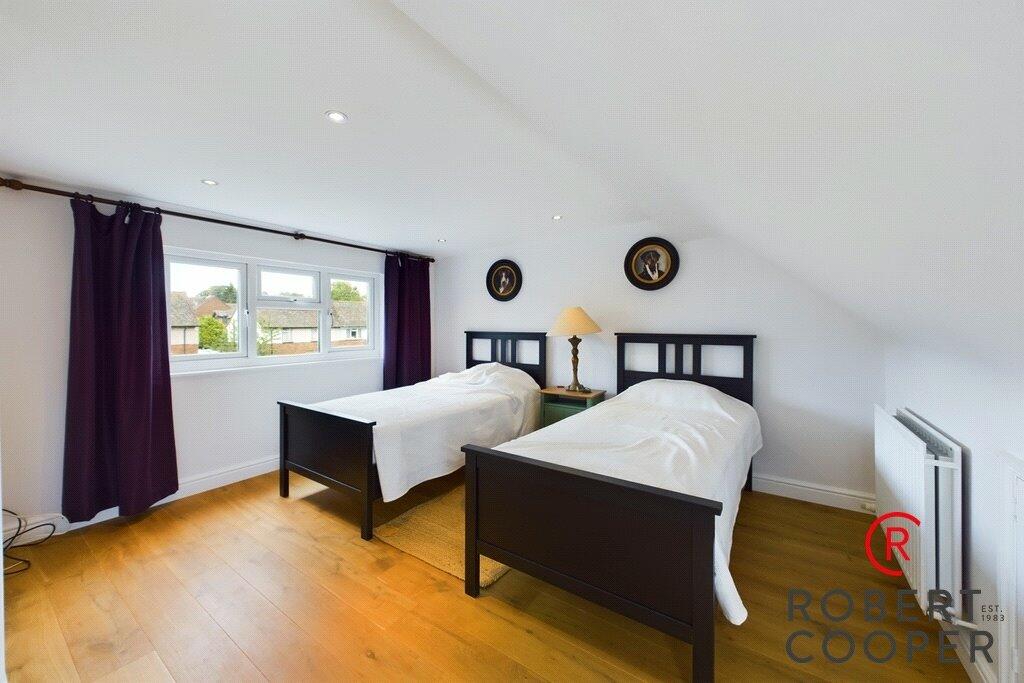
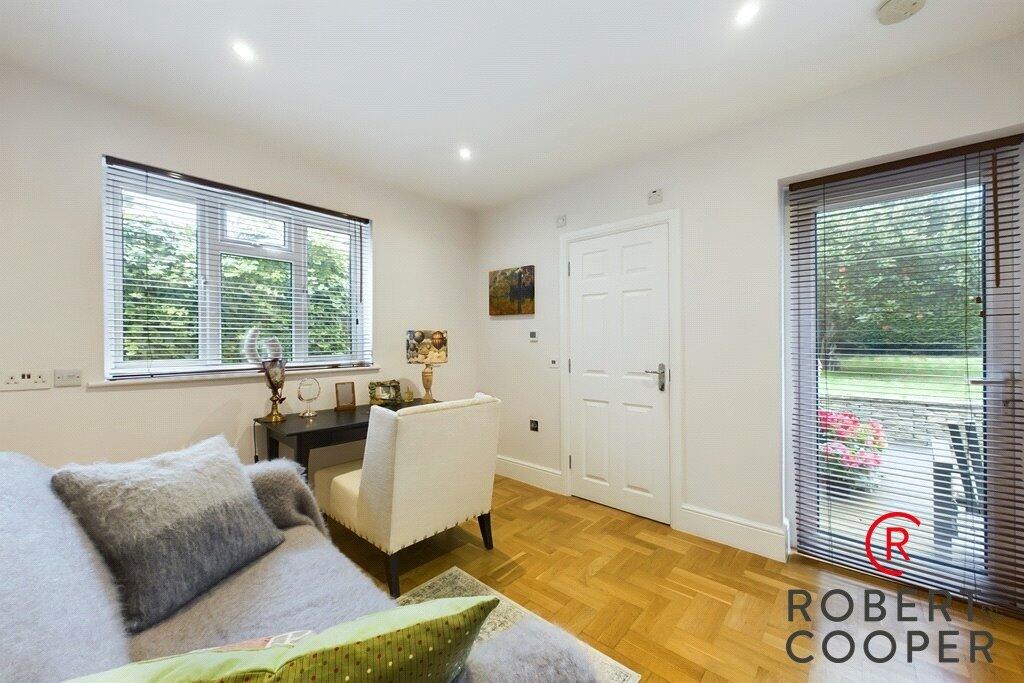
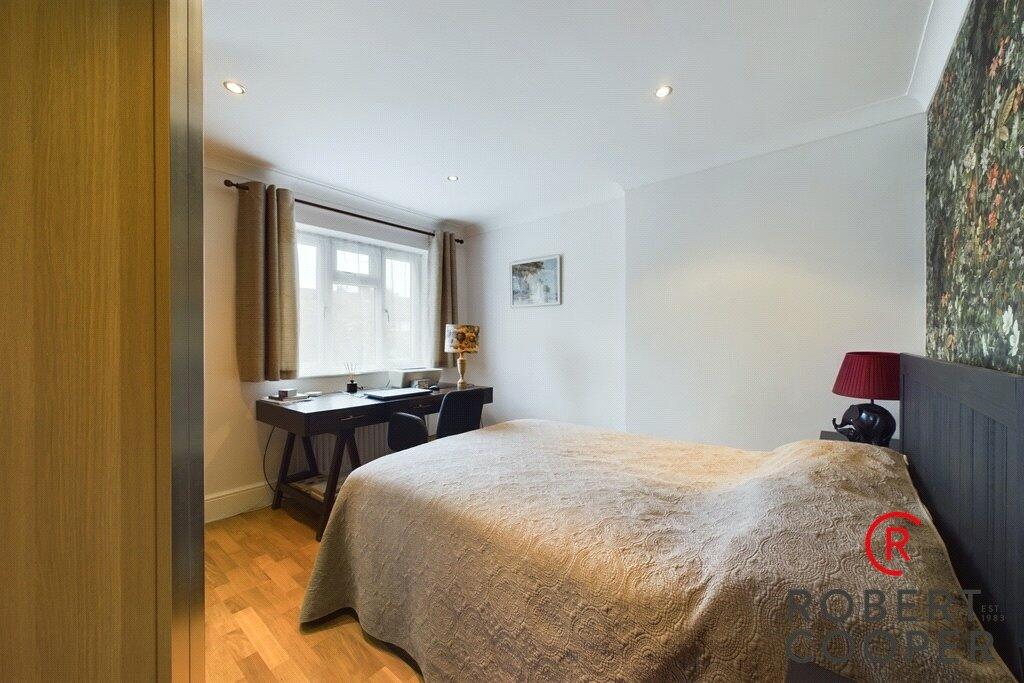
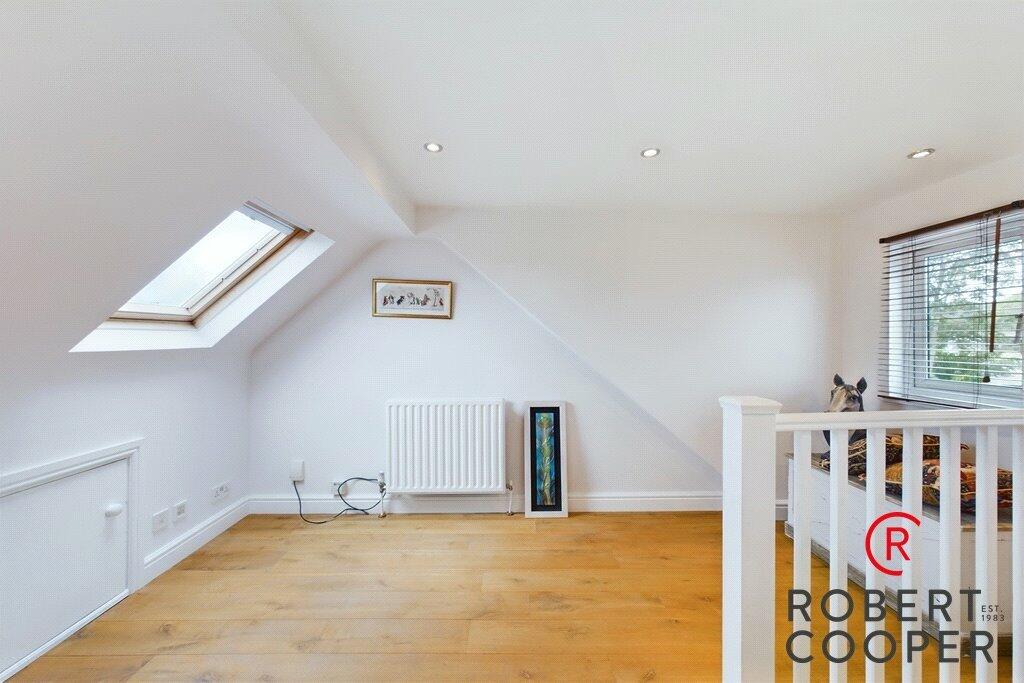
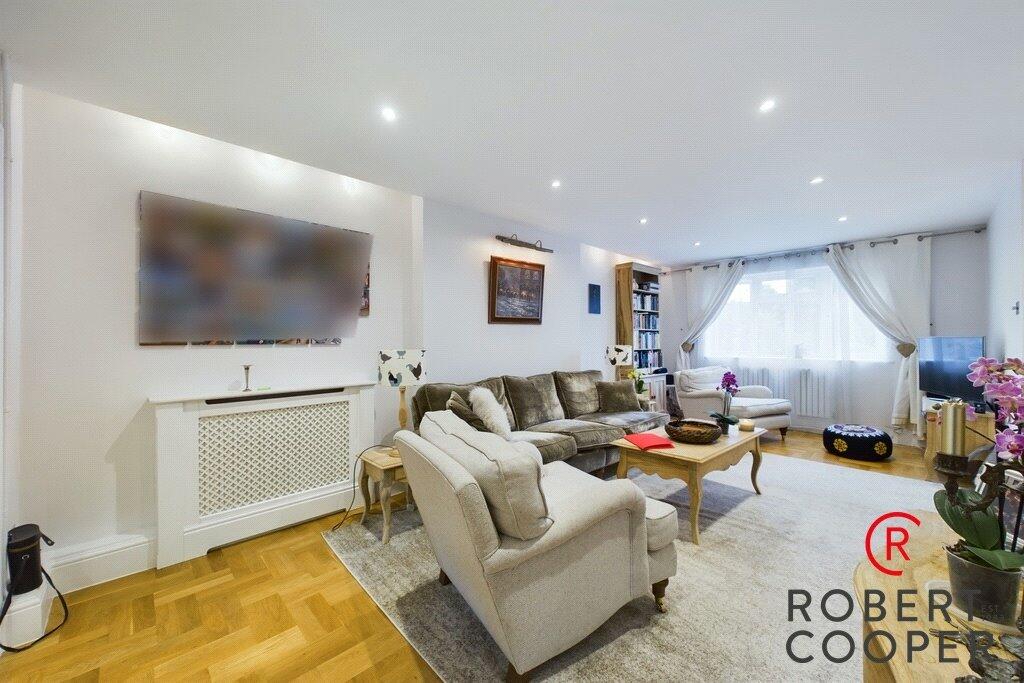
- Family Home
- Five Bedrooms
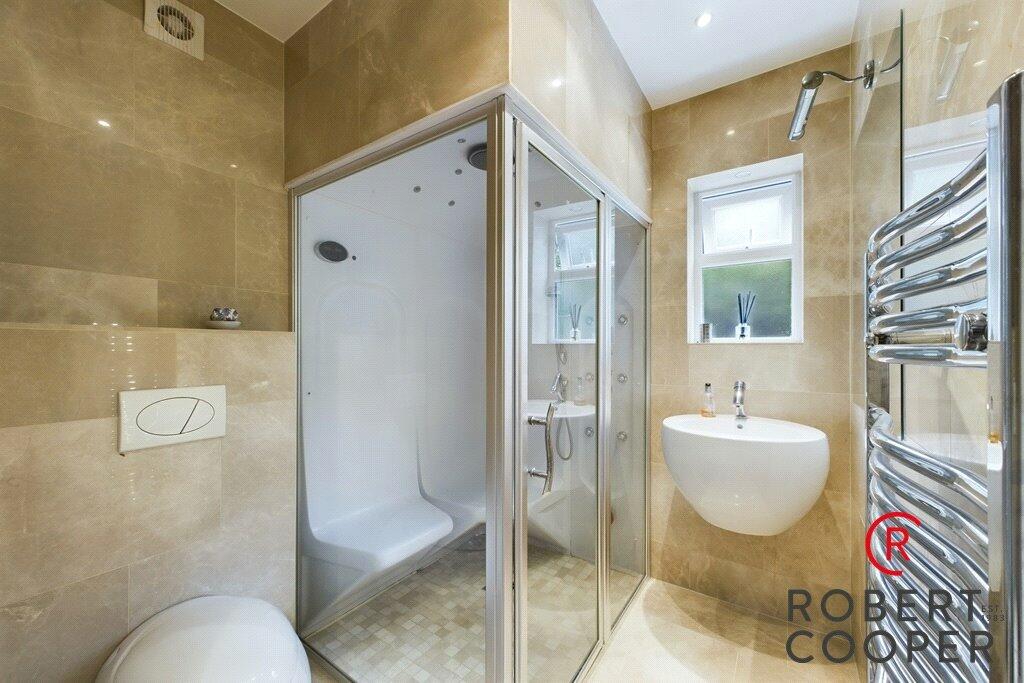
- Two Bathrooms
- Modern Condition
- Quiet Cul-De-Sac Location
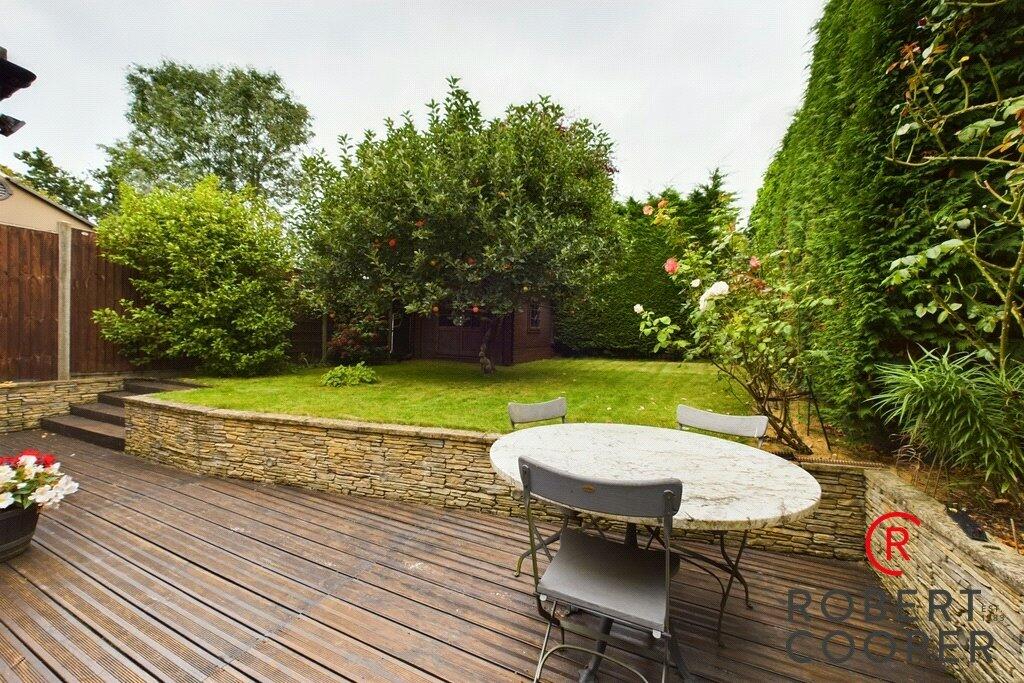
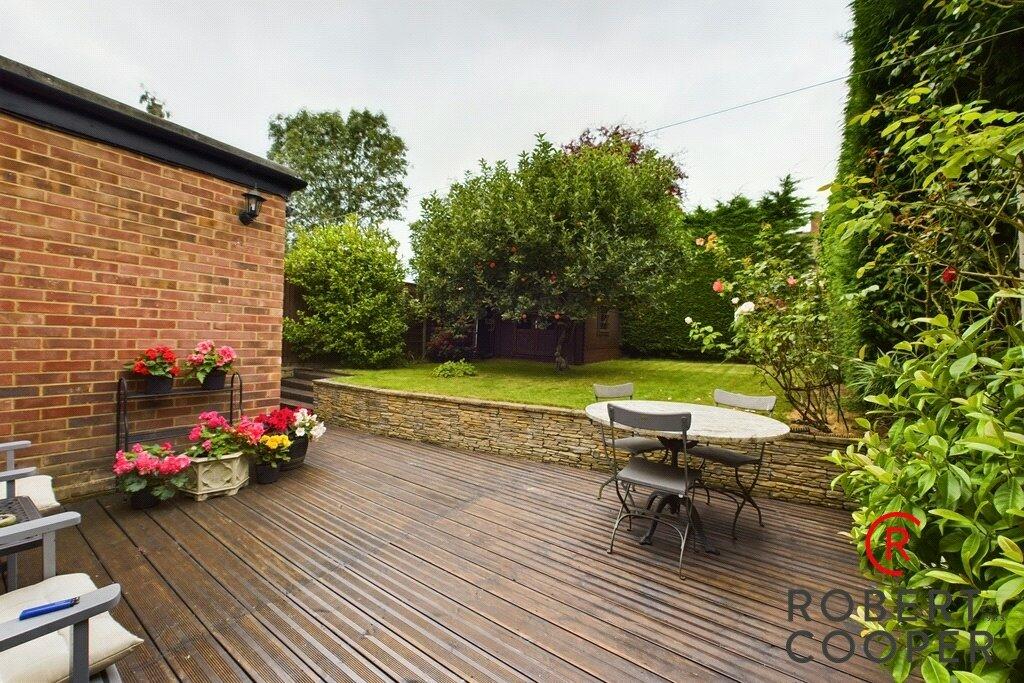
- Private Rear Garden
- Large Driveway With Off Street Parking
- No Upper Chain
- Walking Distance To Metropolitan Line
- Catchment Area For Excellent Schools
Additional details
- Parking
- Yes
- Garden
- Yes
Description
Tenure - Freehold
EPC - D
Council Tax - Band D
Listed by
Eastcote
Robert Cooper & Co
Reference: 151688789
EPC Rating & Upgrade Cost
Current rating: D
Potential rating: B
Inspection date: 23/08/2024
Current heating cost: £1,707/year
Potential heating cost: £1,132/year
Est. upgrade cost to C: £18,585
Recommendations
- Cavity wall insulation (£500 - £1,500)
- Floor insulation (solid floor) (£4,000 - £6,000)
- Low energy lighting for all fixed outlets (£85)
- Upgrade heating controls (£350 - £450)
- Replace boiler with new condensing boiler (£2,200 - £3,000)
- Solar water heating (£4,000 - £6,000)
- Solar photovoltaic panels, 2.5 kWp (£3,500 - £5,500)
Flood risk
Zone: 1
Risk: Low
Job (default Low)
Floorplans
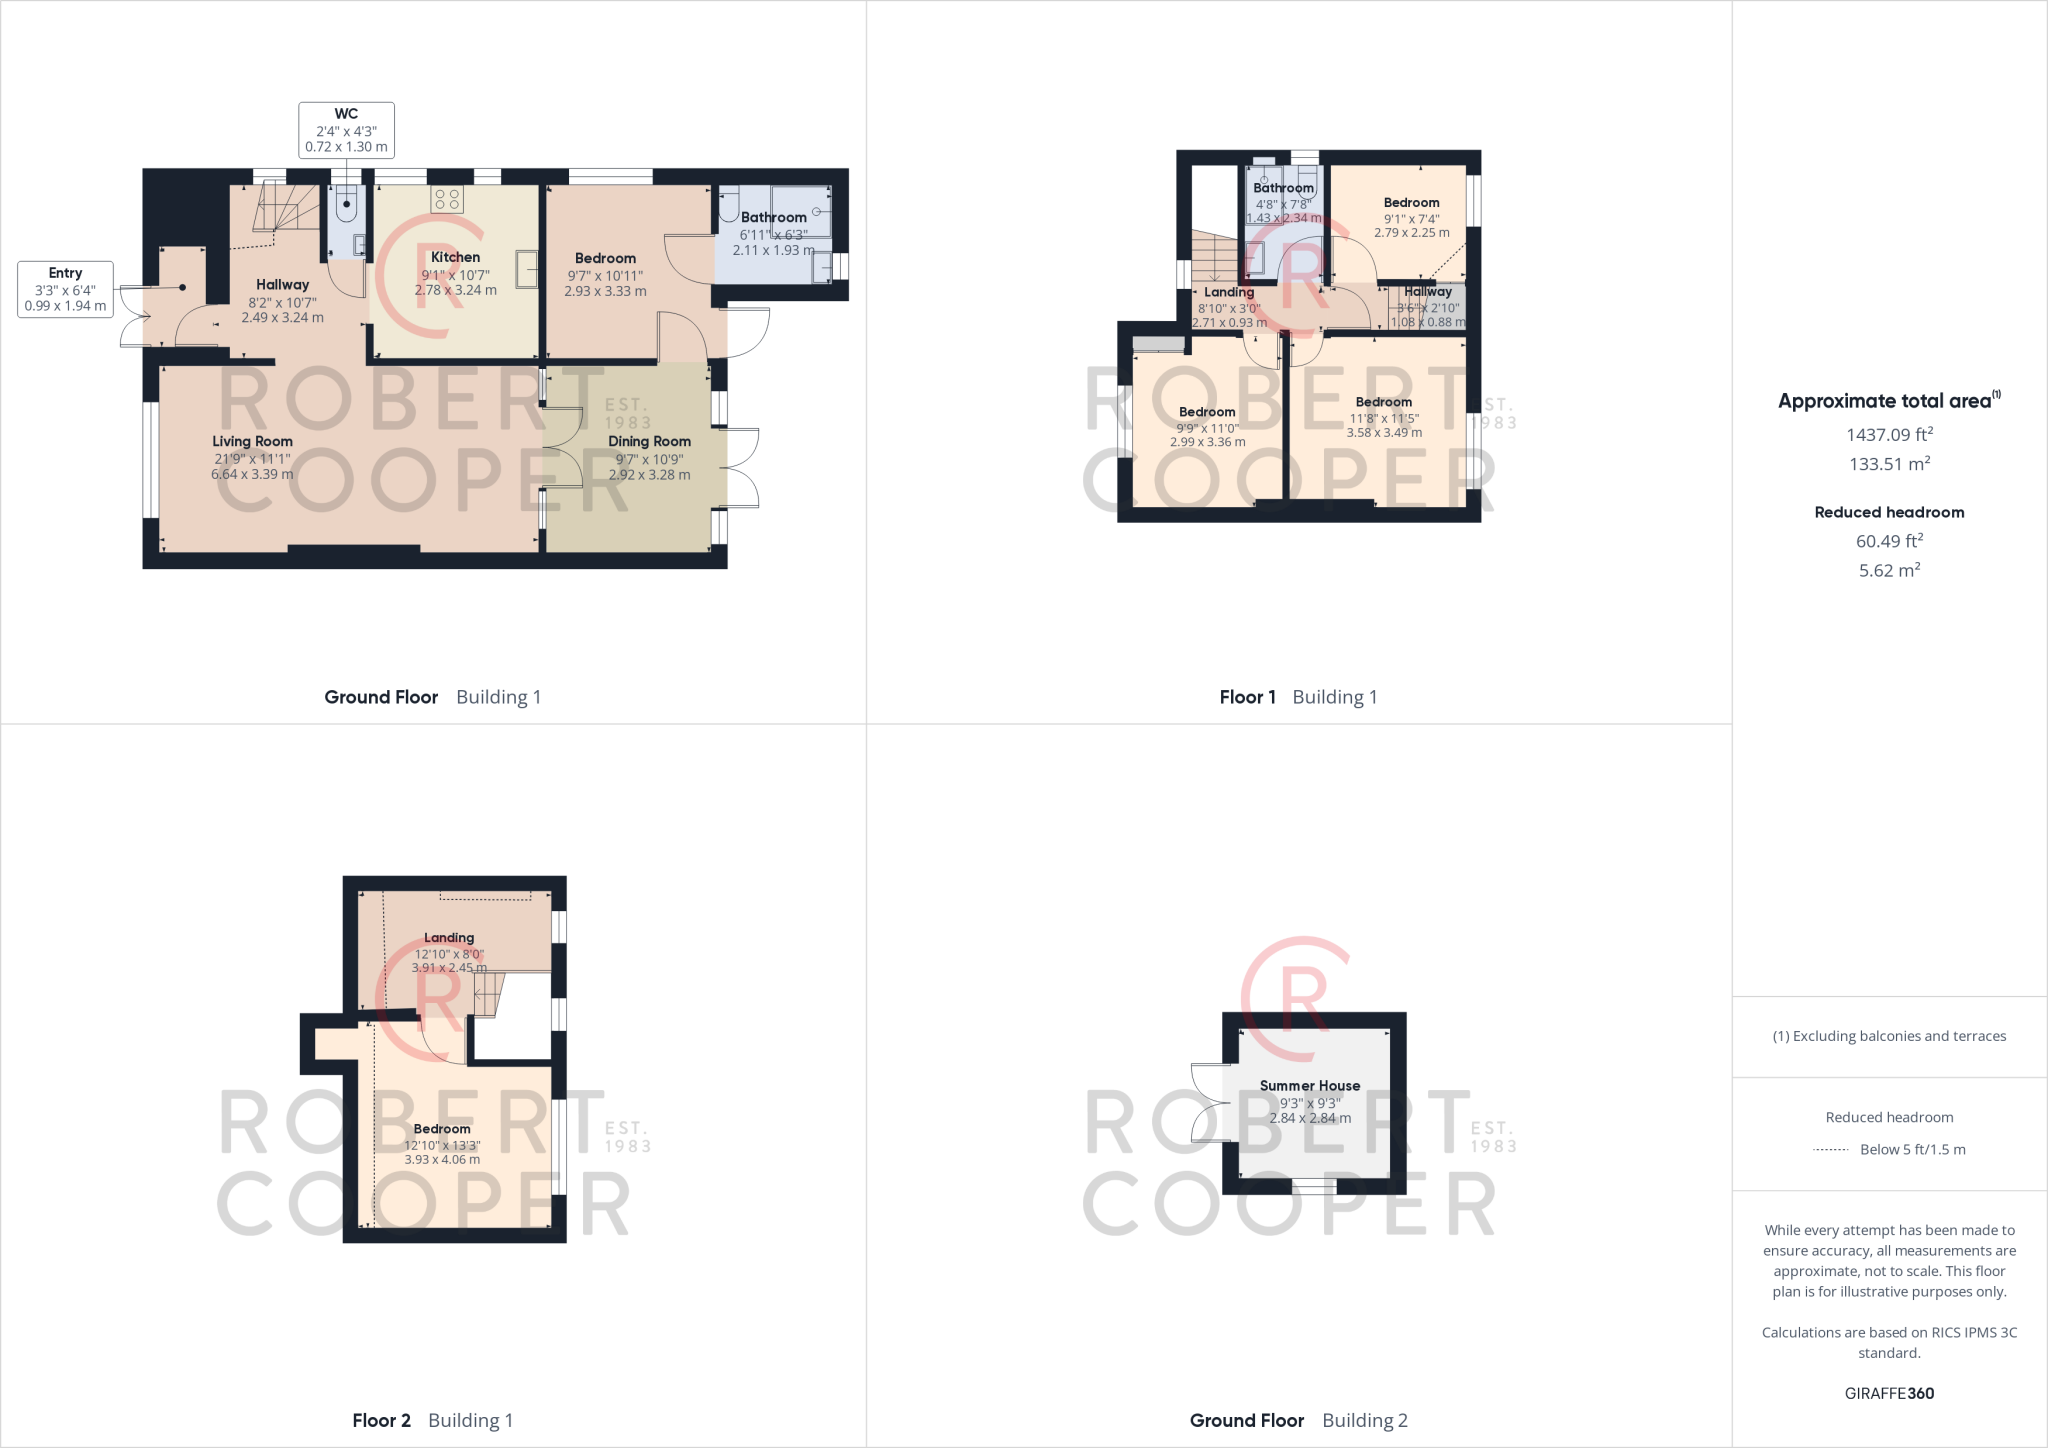
Floorplan
EPC Graphs
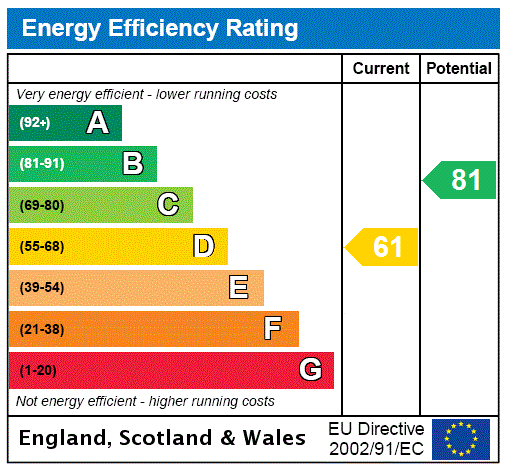
EPC Rating Graph
FENSA Certificates
This property has 1 FENSA certificate(s) on record, indicating window/door installations by FENSA-approved installers.
FENSA Certificate #6887019
Property Details
Street: 9 Malmesbury Close
Town: PINNER
Postcode: HA5 2NG
Installation Details
Items: 3 windows
Certificate Issued: 12/10/2009
Work Completed: 22/09/2009
This certificate data was retrieved from FENSA's database
What is FENSA? FENSA (Fenestration Self-Assessment Scheme) is a government-authorised scheme that monitors building regulation compliance for replacement windows and doors. Certificates indicate that work was completed by FENSA-approved installers.
Price history
337% since 2000
| Event | Date | Price | % change |
|---|---|---|---|
| Sold | 05/06/2025 (1 year ago) | £678,000 | +23.3% |
| Sold | 11/07/2014 (11 years ago) | £550,000 | +28.4% |
| Sold | 03/05/2012 (14 years ago) | £428,500 | +176.5% |
| Sold | 10/10/2000 (25 years ago) | £155,000 | — |
Source: HM Land Registry Price Paid Data. Crown copyright.
Sold Comparables
Same street and nearby sales within 0.25 miles (last 5 years). Data from Land Registry Price Paid.
| Address | Price | Date | Type |
|---|---|---|---|
| 67 FARMLANDS, PINNER, HILLINGDON, GREATER LONDON, HA5 2LN | £650,000 | 13/01/2026 | Terraced |
| 129 WILTSHIRE LANE, PINNER, HILLINGDON, GREATER LONDON, HA5 2NA | £485,000 | 25/11/2025 | Terraced |
| Same street 29 MALMESBURY CLOSE, PINNER, HILLINGDON, GREATER LONDON, HA5 2NG | £545,000 | 29/09/2023 | Terraced |
| 33 CONISTON GARDENS, PINNER, HILLINGDON, GREATER LONDON, HA5 2JJ | £375,000 | 08/08/2023 | Terraced |
| Same street 15 MALMESBURY CLOSE, PINNER, HILLINGDON, GREATER LONDON, HA5 2NG | £582,000 | 01/08/2022 | Terraced |
| 25 FARMLANDS, PINNER, HILLINGDON, GREATER LONDON, HA5 2LW | £700,000 | 01/07/2022 | Terraced |
| 9 MAYBANK GARDENS, PINNER, HILLINGDON, GREATER LONDON, HA5 2JW | £580,000 | 10/06/2022 | Terraced |
| 19 WYEVALE CLOSE, PINNER, HILLINGDON, GREATER LONDON, HA5 2QE | £515,000 | 21/02/2022 | Terraced |
| 11 LYNEHAM WALK, PINNER, HILLINGDON, GREATER LONDON, HA5 2NR | £450,000 | 04/02/2022 | Terraced |
| 206 FORE STREET, PINNER, HILLINGDON, GREATER LONDON, HA5 2NE | £570,000 | 25/10/2021 | Terraced |
| 11 LYNEHAM WALK, PINNER, HILLINGDON, GREATER LONDON, HA5 2NR | £398,000 | 30/09/2021 | Terraced |
| 125 WILTSHIRE LANE, PINNER, HILLINGDON, GREATER LONDON, HA5 2NA | £435,000 | 29/09/2021 | Terraced |
| 3 REID CLOSE, PINNER, HILLINGDON, GREATER LONDON, HA5 2QD | £390,000 | 24/09/2021 | Terraced |
Street average: £563,500 (2 sales)
Area average: £504,364 (11 sales)
Capital growth trend
Land Registry outcode average: last 12 months vs 5y and 10y ago (from sold prices).
House Price Index (HM Land Registry — official index, not sold-price averages): Hillingdon. Series: Terraced. As of March 2026.
Rental Range
Estimated market rent for Hillingdon. Low = conservative, Realistic = average, Optimistic = best case.
Based on Local Authority from postcode lookup → Hillingdon.
LHA (30th percentile) floor for North West London: £2,094/mo (Apr 2025 – Mar 2026)
Location
Nearby
Nearest stations, universities and amenities (distance from property).
| Type | Name | Distance |
|---|---|---|
| Bus stop | Haydon Drive | 0.2 miles |
| Bus stop | Middleton Drive | 0.2 miles |
| Shop | Budgens | 0.5 miles |
| Shop | Tesco Express | 0.5 miles |
| Train station | Northwood Hills | 0.6 miles |
| Train station | Woody Bay | 0.7 miles |
| Hospital | Watford General Hospital | 4.0 miles |
| University | John Scales Centre for Biomedical Engineering | 5.0 miles |
| University | University of West London | 7.1 miles |
| Hospital | Hounslow Medical Centre | 8.6 miles |
Street-level crime
| Category | Count |
|---|---|
| Anti-social behaviour | 28 |
| Violence and sexual offences | 26 |
| Other theft | 15 |
| Vehicle crime | 10 |
| Burglary | 8 |
| Criminal damage and arson | 8 |
| Public order | 6 |
| Shoplifting | 5 |
| Robbery | 4 |
| Drugs | 3 |
| Other crime | 1 |
| Theft from the person | 1 |
| Total incidents | 115 |
Within 1 mile during Apr 2026. Source: data.police.uk (England & Wales).
Schools nearby
Nearest open schools with Ofsted ratings (England). Closed schools are not shown. Data from Get Information about Schools and Ofsted.
| Name | Type | Distance | Ofsted |
|---|---|---|---|
| Haydon School | Secondary | 0.2 miles | Good — 22 Nov 2022 |
| Coteford Junior School | Primary | 0.3 miles | Good — 4 Sep 2015 |
| Coteford Infant School | Primary | 0.5 miles | Good — 10 Feb 2012 |
| Harlyn Primary School | Primary | 0.6 miles | — (Inspected (no overall grade)) |
| Northwood School | Secondary | 0.8 miles | Outstanding — 5 Nov 2018 |
Rental Comparables
Loading rental comparables for this postcode. Refresh in a few minutes.
Rent-driven metrics
Based on Area rent estimate.
- Rent ratio — Monthly rent ÷ purchase price (1% rule). 1%+ = strong, 0.8–1% = okay, <0.8% = weak for cashflow.
- Max investor price — Rent ÷ 0.8%; the price at which rent would be 0.8% of price (Stoke-style target).
- Target investor price — Rent ÷ 1%; the price at which rent would be 1% of price (strong cashflow band).
- Gross yield — Annual rent as % of purchase price (no costs).