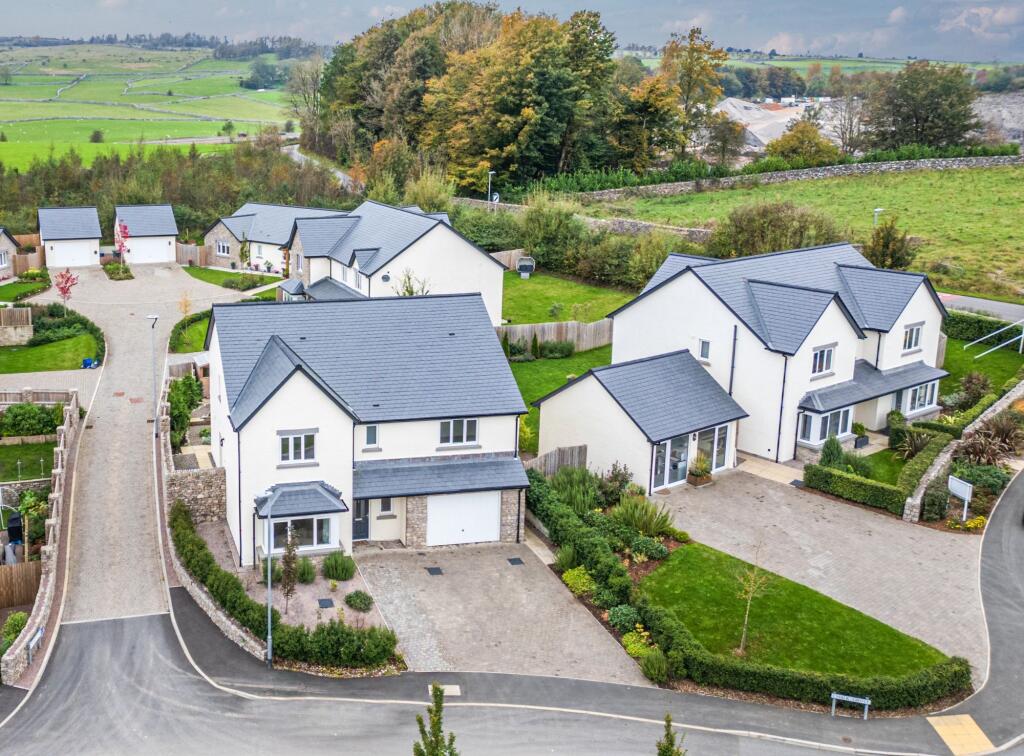
2 CHALK GROVE
KENDAL, WESTMORLAND AND FURNESS, LA9 5FR
£600,000
Location
Property details
Tenure
Freehold
Property type
Detached
Bedrooms
5
Bathrooms
3
Floor area
180 m²
EPC rating
B
Last sold
£600,000 Feb 2026
Price per m²
£3,333/m²
Local average
£479,234 (36 sales)
EPC Rating & Upgrade Cost
Current rating: B
Potential rating: A
Inspection date: 18/04/2023
Expiry date: 17/04/2033
Est. upgrade cost to C: £9,500
Recommendations
- Solar water heating (£4,000 - £6,000)
- Solar photovoltaic panels, 2.5 kWp (£3,500 - £5,500)
Price history
| Event | Date | Price | Type | % change | Today’s value (HPI) | Action |
|---|---|---|---|---|---|---|
| Sold | 11/02/2026 | £600,000 | Detached | -11.8% | £598,333 to April 2026 | View transaction |
| Sold | 22/08/2023 | £680,000 | Detached | — | £727,992 to April 2026 | View transaction |
Historic listings
Listing and sale events only where we matched the listing page to a Land Registry sale already on record for this address.
| Event | Date | Price |
|---|---|---|
| sold | 01/01/2026 | £600,000 |
| listed | 22/10/2025 | £650,000 |
| sold | 01/01/2023 | £680,000 |
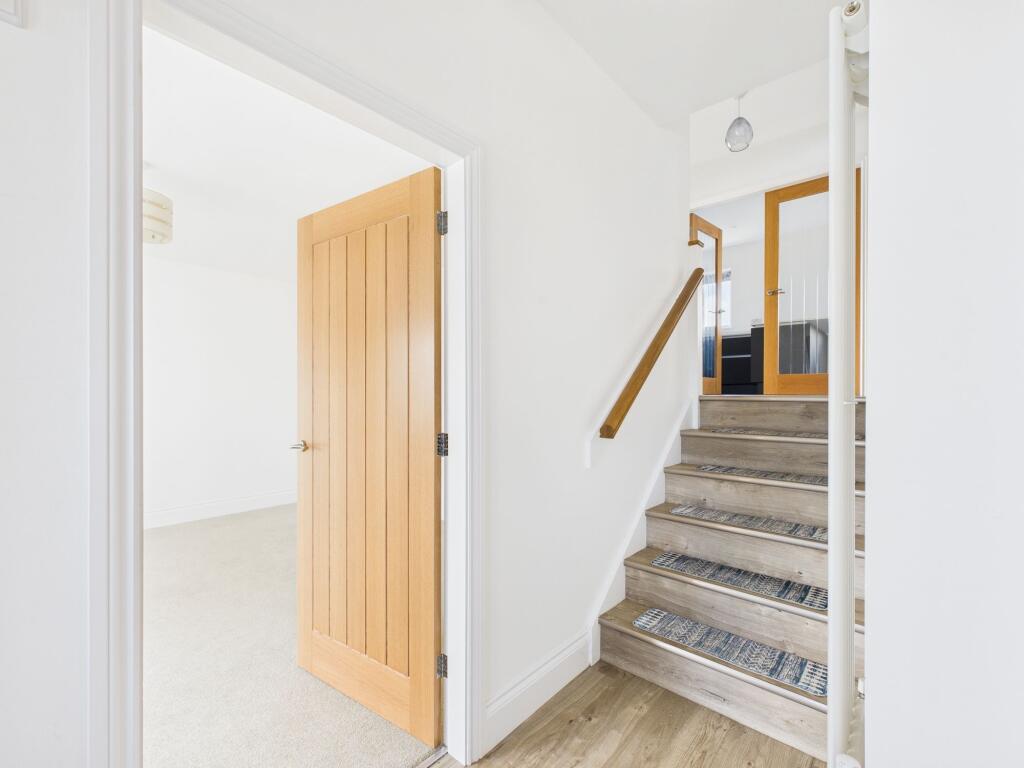
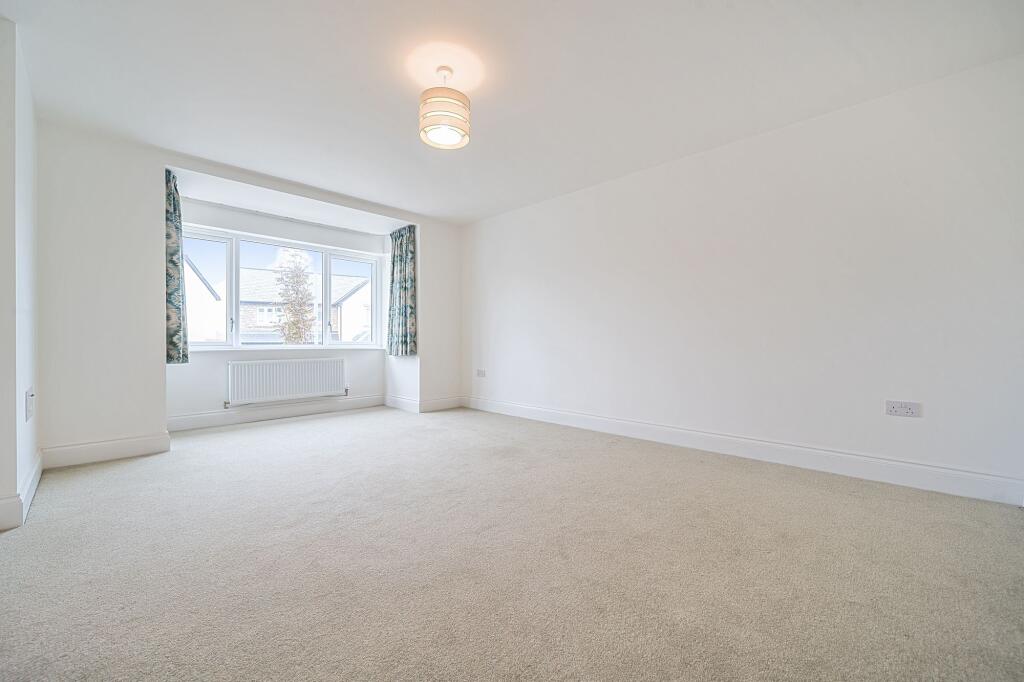
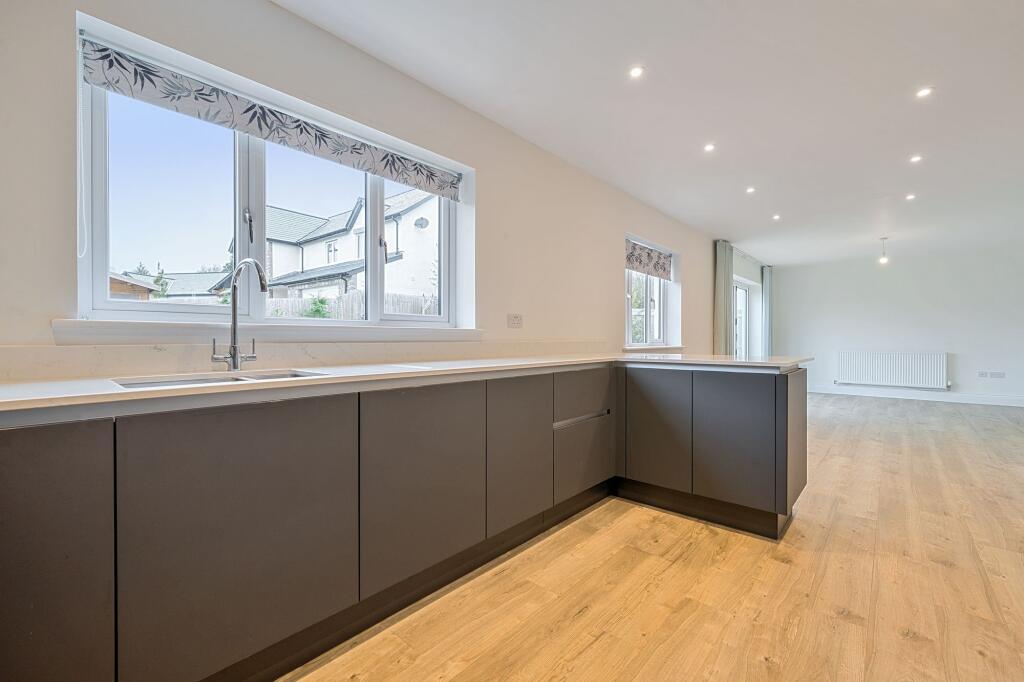
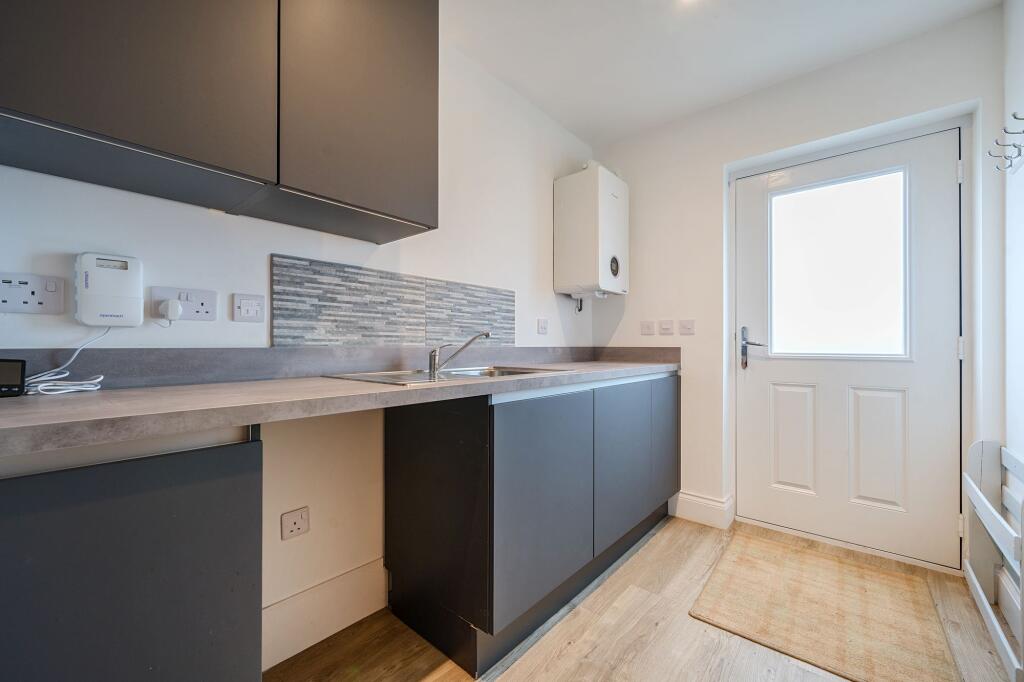
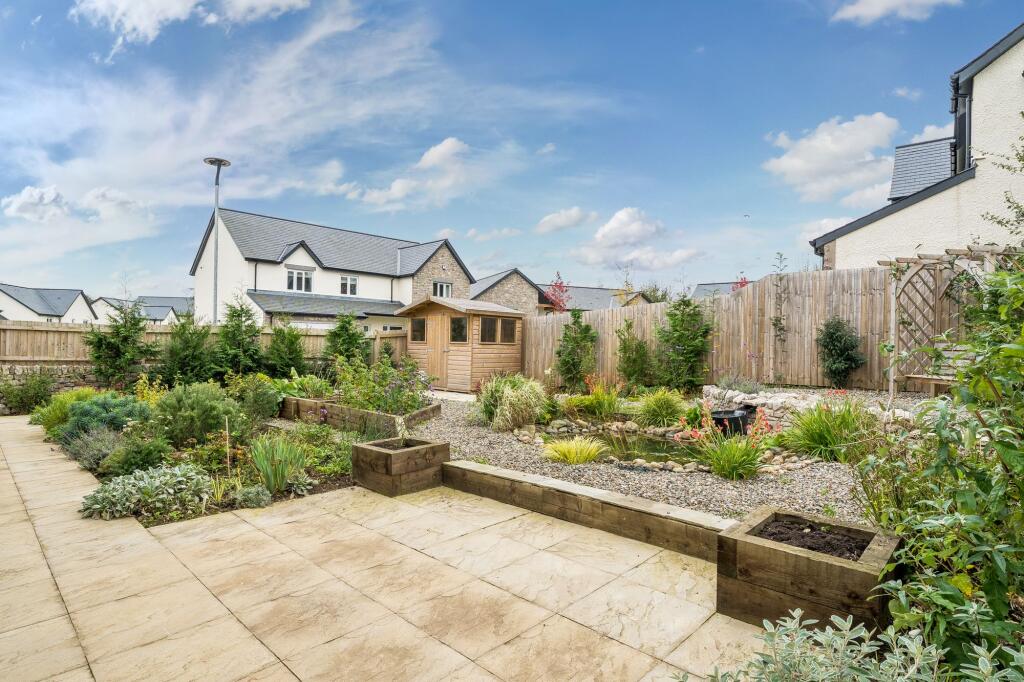
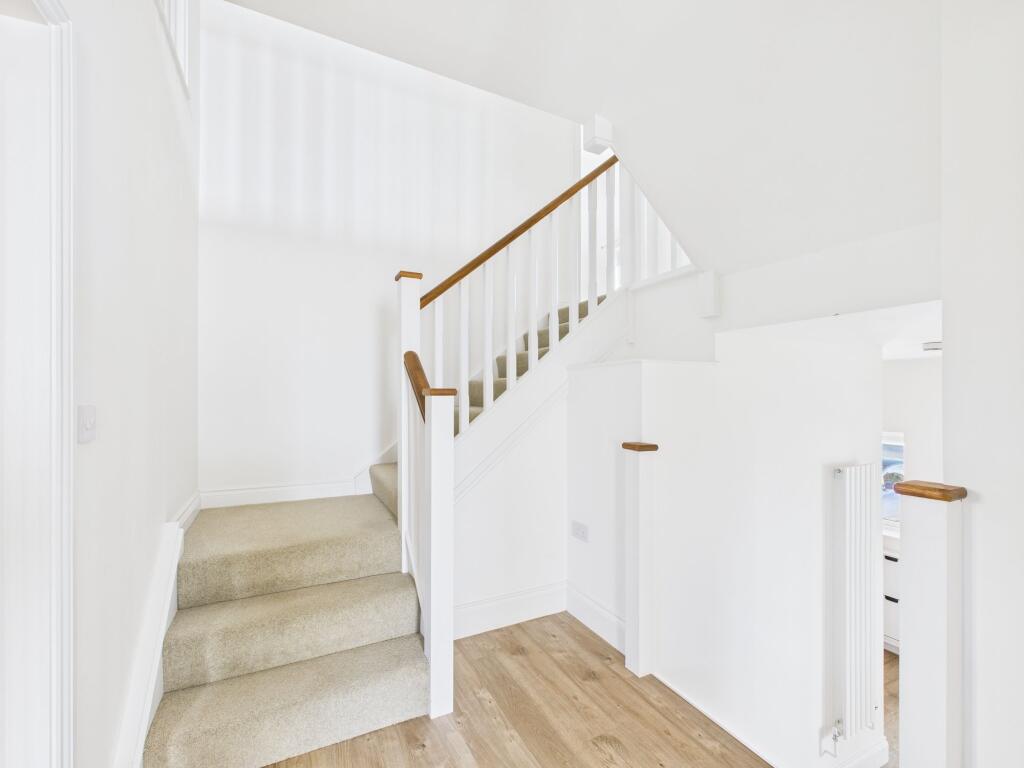
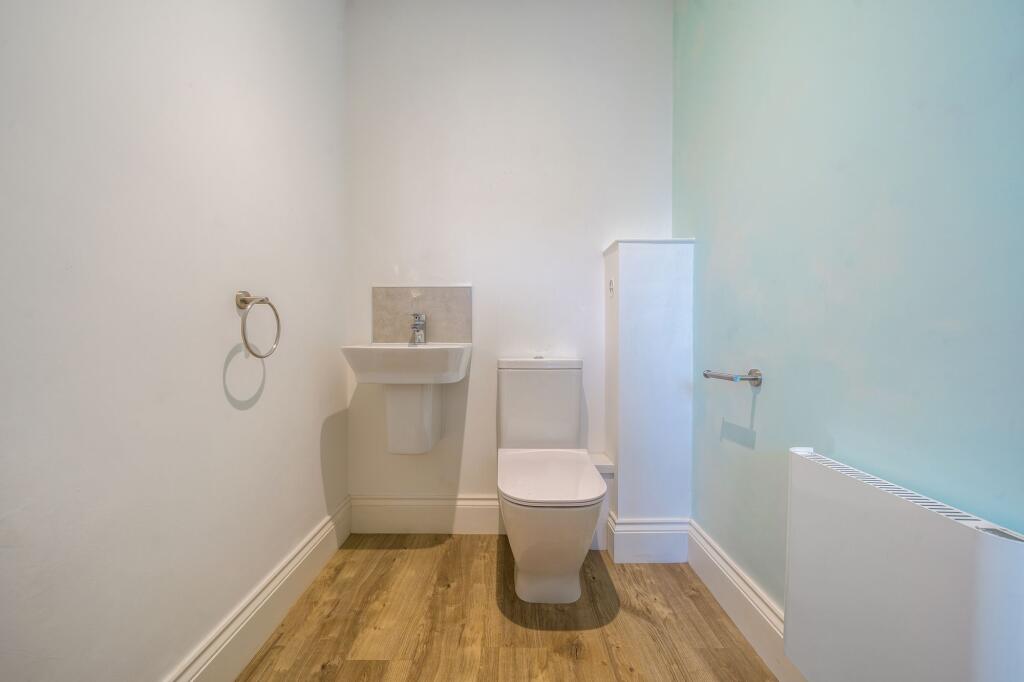
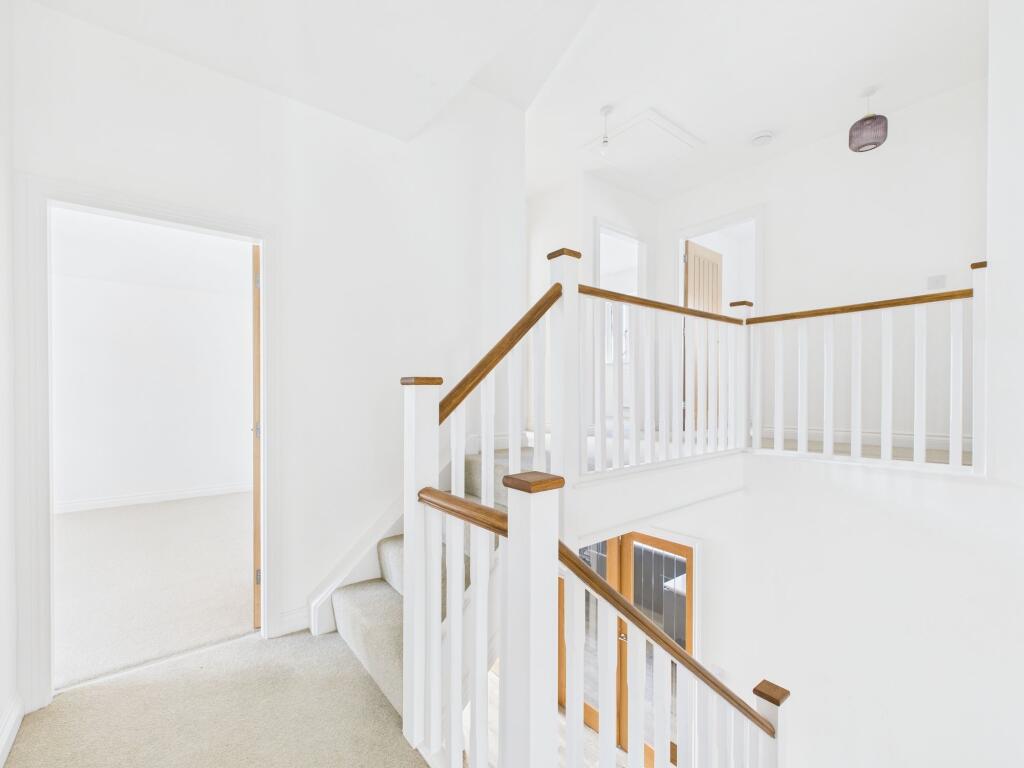
Photos · Open listing
 Open image 1 from listing 168497255
 Open image 2 from listing 168497255
 Open image 3 from listing 168497255
 Open image 4 from listing 168497255
 Open image 5 from listing 168497255
 Open image 6 from listing 168497255
 Open image 7 from listing 168497255
 Open image 8 from listing 168497255
 Open image 9 from listing 168497255
 Open image 10 from listing 168497255
 Open image 11 from listing 168497255
 Open image 12 from listing 168497255
Sold comparables
Same street and nearby sales within 0.25 miles (last 5 years). Land Registry Price Paid Data.
| Address | Price | Date | Type |
|---|---|---|---|
| 20 CHALK GROVE, KENDAL, WESTMORLAND AND FURNESS, LA9 5FR | £725,000 | 02/06/2025 | Detached |
| 13 CHALK GROVE, KENDAL, WESTMORLAND AND FURNESS, LA9 5FR | £680,000 | 31/03/2025 | Detached |
| 15 CHALK GROVE, KENDAL, WESTMORLAND AND FURNESS, LA9 5FR | £693,500 | 28/03/2025 | Detached |
| 4 CHALK GROVE, KENDAL, WESTMORLAND AND FURNESS, LA9 5FR | £735,000 | 21/12/2023 | Detached |
| 12 CHALK GROVE, KENDAL, WESTMORLAND AND FURNESS, LA9 5FR | £560,000 | 26/10/2023 | Detached |
Area average: £678,700 (5 sales)
For sale comparables
No active for-sale comparables found within 1 mile for the same bedrooms and property type.
Capital growth trend
Land Registry outcode average: last 12 months vs 5y and 10y ago (from sold prices).
House Price Index (HM Land Registry — official index, not sold-price averages): North West. Series: Detached. As of April 2026.
Rental Range
Estimated market rent for North West. Low = conservative, Realistic = average, Optimistic = best case.
Based on Postcode area LA → North West.
LHA (30th percentile) floor for Kendal: Apr 2025 – Mar 2026
Rental Comparables
Loading rental comparables for this postcode. Refresh in a few minutes.
Rent-driven metrics
Based on Area rent estimate.
- Rent ratio — Monthly rent ÷ purchase price (1% rule). 1%+ = strong, 0.8–1% = okay, <0.8% = weak for cashflow.
- Max investor price — Rent ÷ 0.8%; the price at which rent would be 0.8% of price (Stoke-style target).
- Target investor price — Rent ÷ 1%; the price at which rent would be 1% of price (strong cashflow band).
- Gross yield — Annual rent as % of purchase price (no costs).
Flood risk
Flood zone data is not yet available for this property.
Street-level crime
Crime data is not yet available for this property.
FENSA
No FENSA certificates found for this address.