8 MOUNT ROAD
HINCKLEY, HINCKLEY AND BOSWORTH, LEICESTERSHIRE, LE10 1AF
£355,000
Location
Nearby
Nearest stations, universities and amenities (distance from property).
| Type | Name | Distance |
|---|---|---|
| Bus stop | St Mary's Road | 0.1 miles |
| Shop | WED2B | 0.1 miles |
| Train station | Hinckley | 0.3 miles |
| Hospital | Stewart House | 7.4 miles |
Property details
Tenure
Freehold
Property type
Semi-detached
Bedrooms
4
Bathrooms
3
Floor area
171 m²
EPC rating
E
Year built
England and Wales: 1900-1929
Last sold
£355,000 Jul 2026
Price per m²
£2,076/m²
Local average
£249,927 (99 sales)
Street crime
244 incidents within 1 mile (Aug 2026)
EPC Rating & Upgrade Cost
Current rating: E
Potential rating: C
Inspection date: 11/04/2017
Expiry date: 10/04/2027
Current heating cost: £1,780/year
Potential heating cost: £995/year
Recommendations
- Increase loft insulation to 270 mm (350)
- 50 mm internal or external wall insulation (14,000)
- Floor insulation (suspended floor) (1,200)
- Replace single glazed windows with low-E double glazing (6,500)
- Solar photovoltaic panels, 2.5 kWp (8,000)
Price history
| Event | Date | Price | Type | % change | Today’s value (HPI) | Action |
|---|---|---|---|---|---|---|
| Sold | 10/07/2026 | £355,000 | Semi-detached | +24.6% | £355,000 to July 2026 | View transaction |
| Sold | 15/06/2017 | £285,000 | Semi-detached | +19.2% | £418,734 to July 2026 | View transaction |
| Sold | 03/06/2011 | £239,000 | Semi-detached | +202.5% | £468,422 to July 2026 | View transaction |
| Sold | 26/07/1999 | £79,000 | Semi-detached | — | £367,118 to July 2026 | View transaction |
Historic listings
Listing and sale events only where we matched the listing page to a Land Registry sale already on record for this address.
| Event | Date | Price |
|---|---|---|
| sold | 01/01/2026 | £355,000 |
| listed | 26/12/2025 | £367,500 |
| sold | 01/01/2017 | £285,000 |
| sold | 01/01/2011 | £239,000 |
| sold | 01/01/1999 | £79,000 |
Photos · Open listing
 Open image 1 from listing 170637806
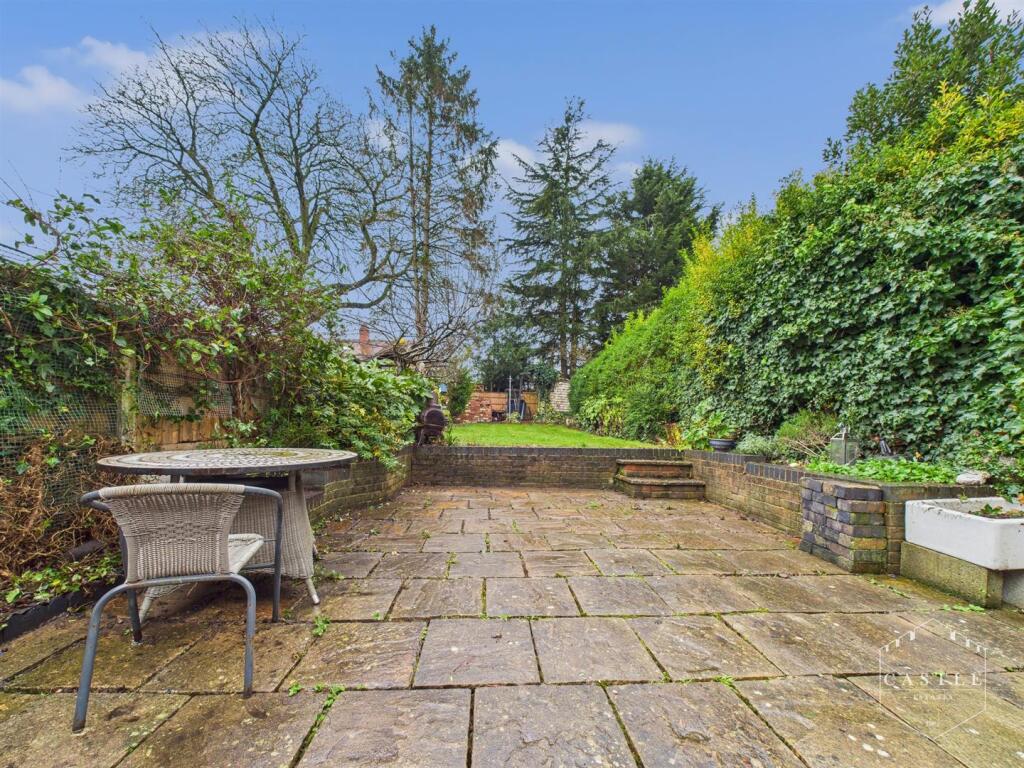 Open image 2 from listing 170637806
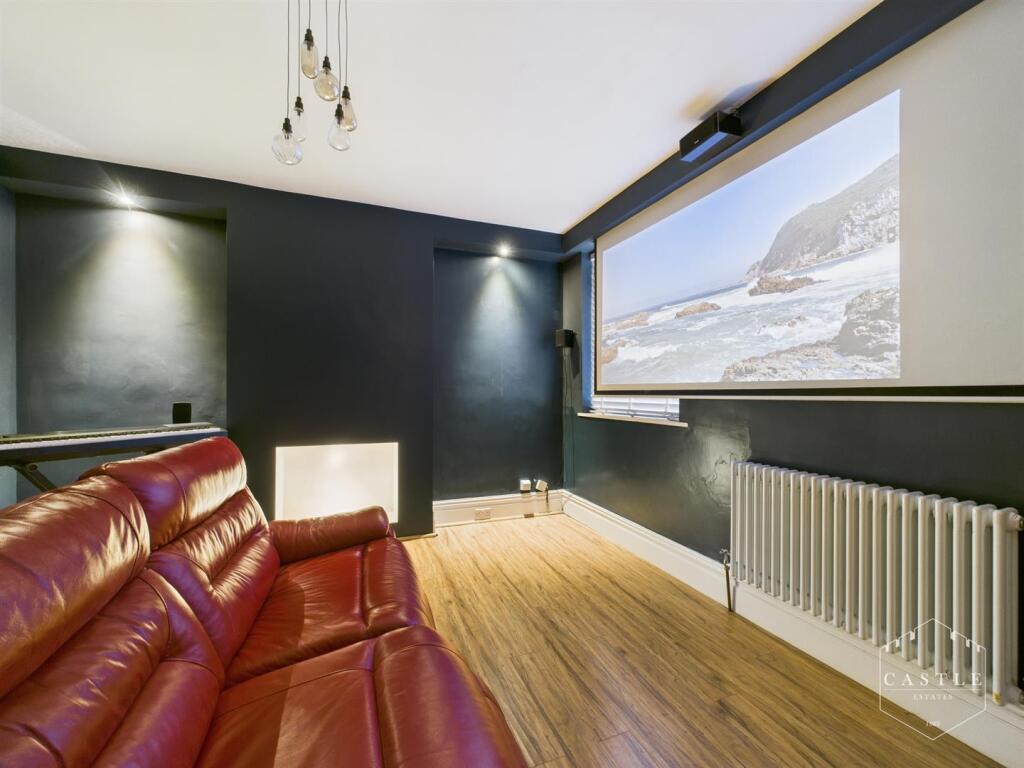 Open image 3 from listing 170637806
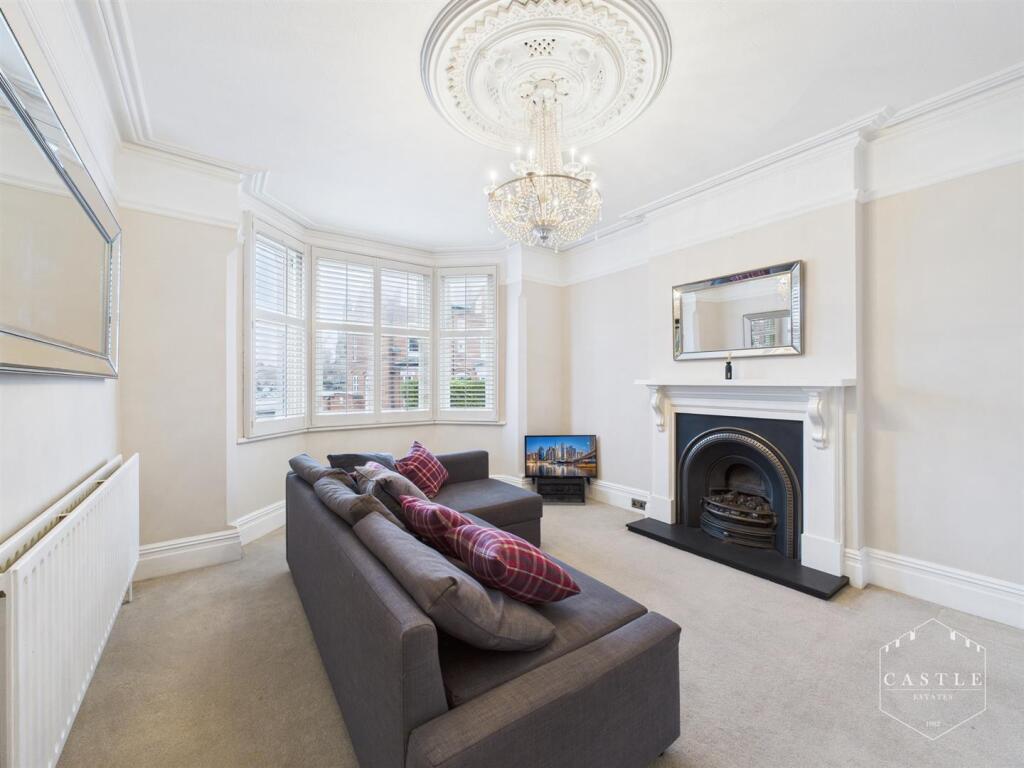 Open image 4 from listing 170637806
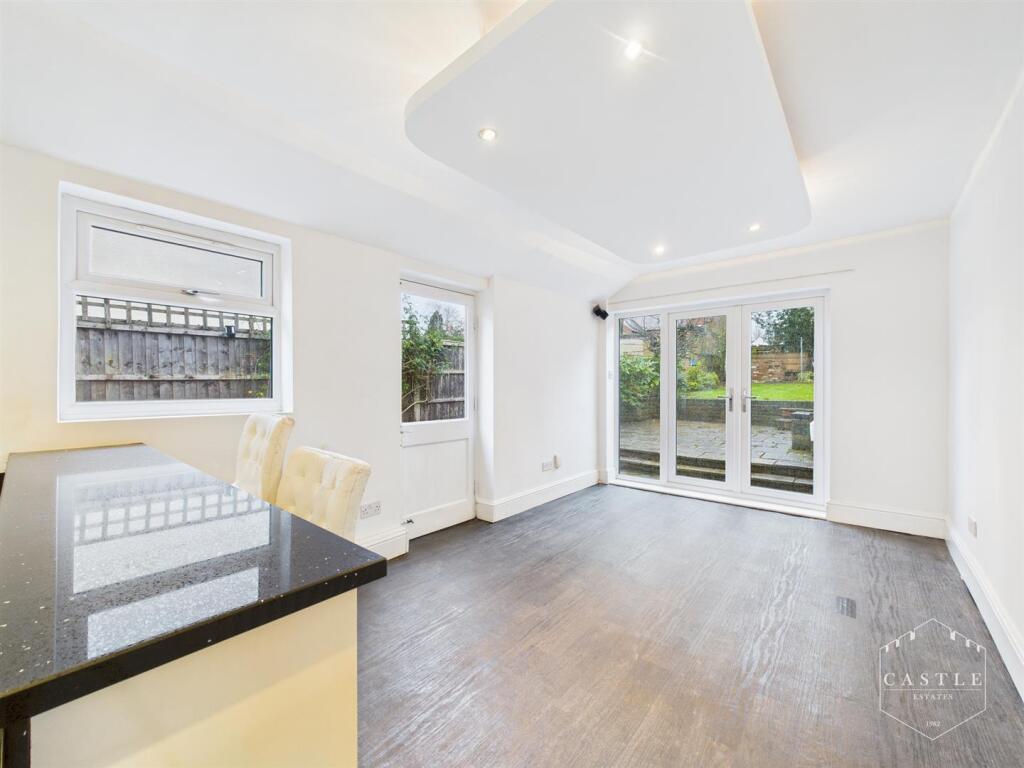 Open image 5 from listing 170637806
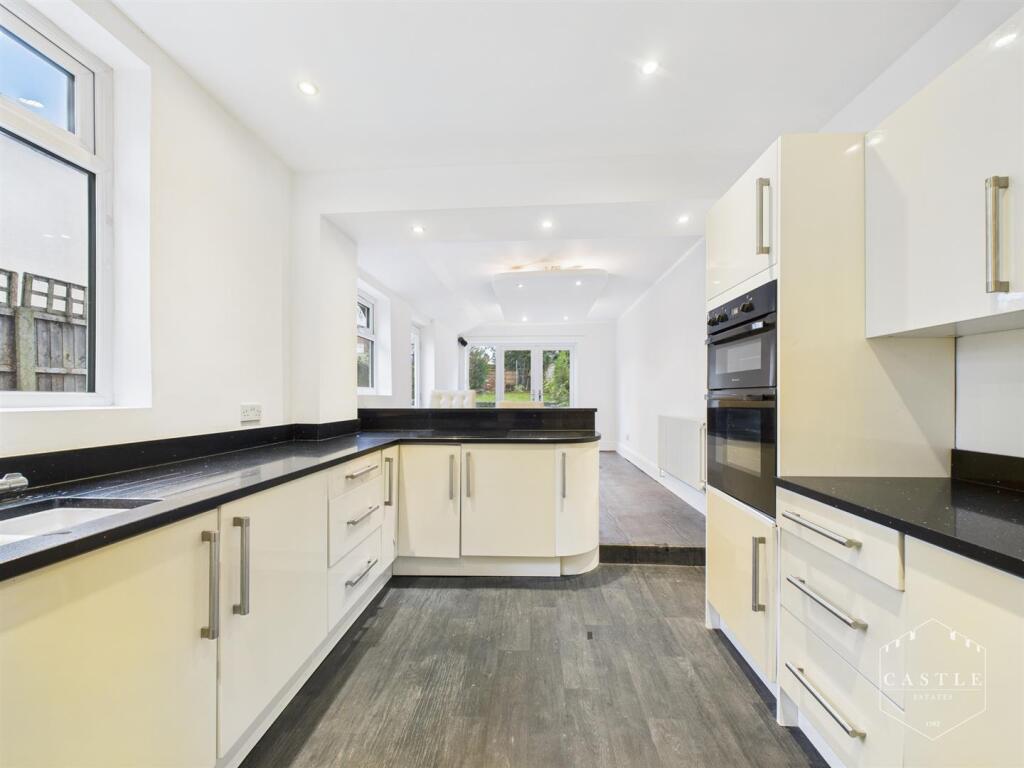 Open image 6 from listing 170637806
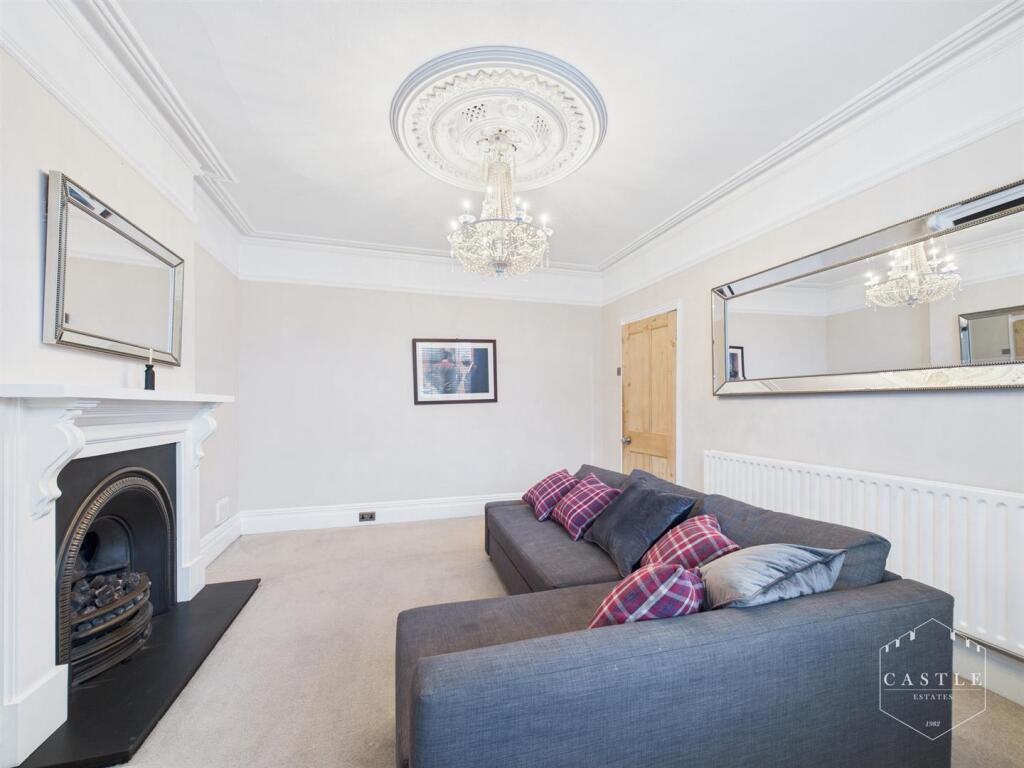 Open image 7 from listing 170637806
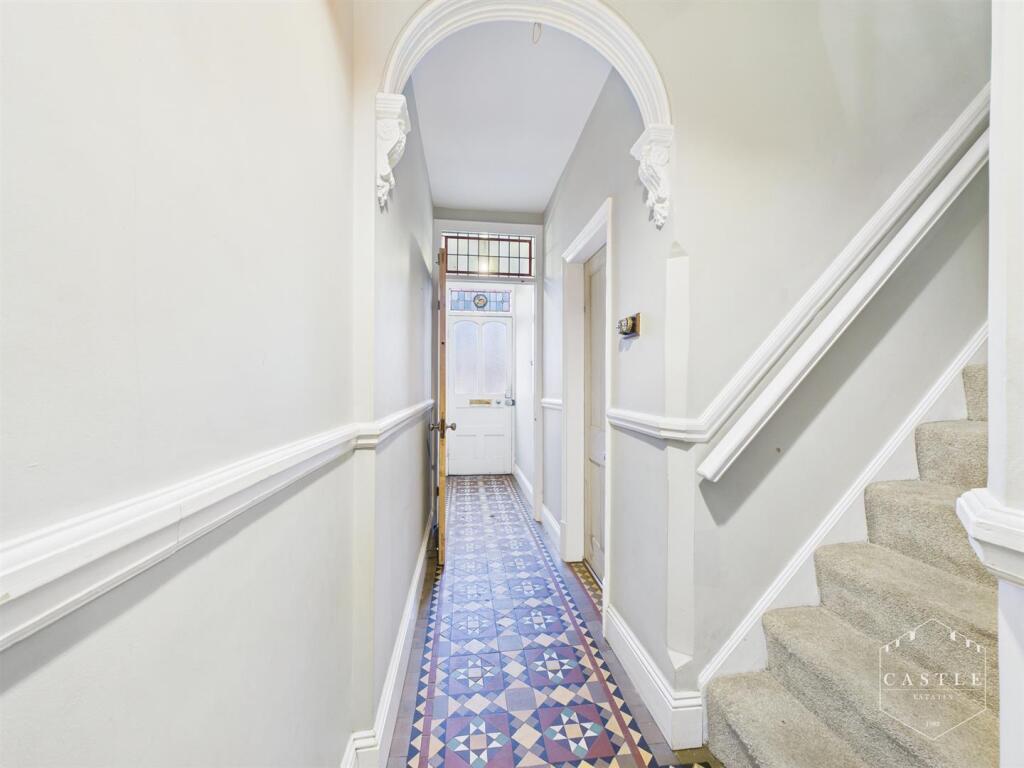 Open image 8 from listing 170637806
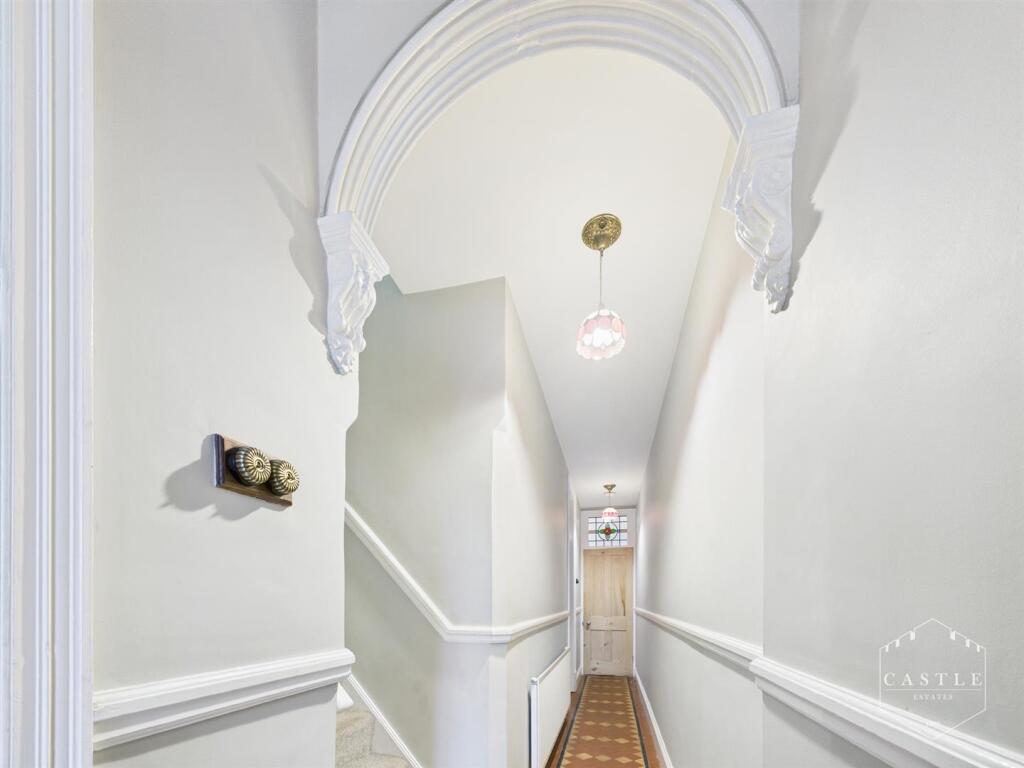 Open image 9 from listing 170637806
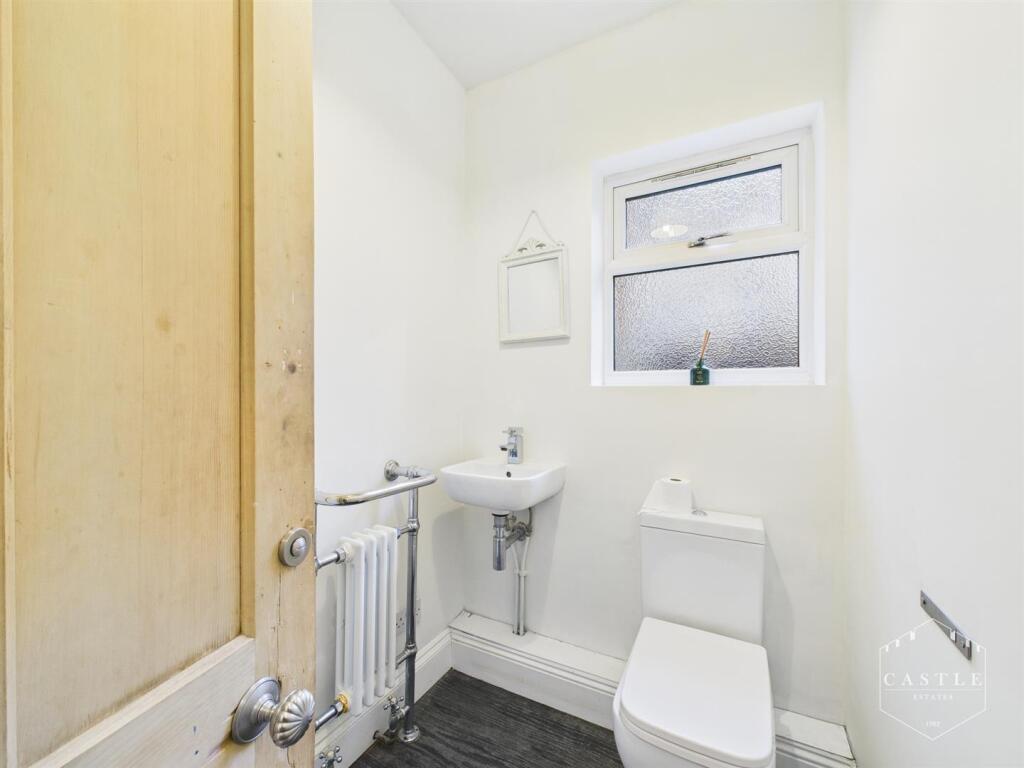 Open image 10 from listing 170637806
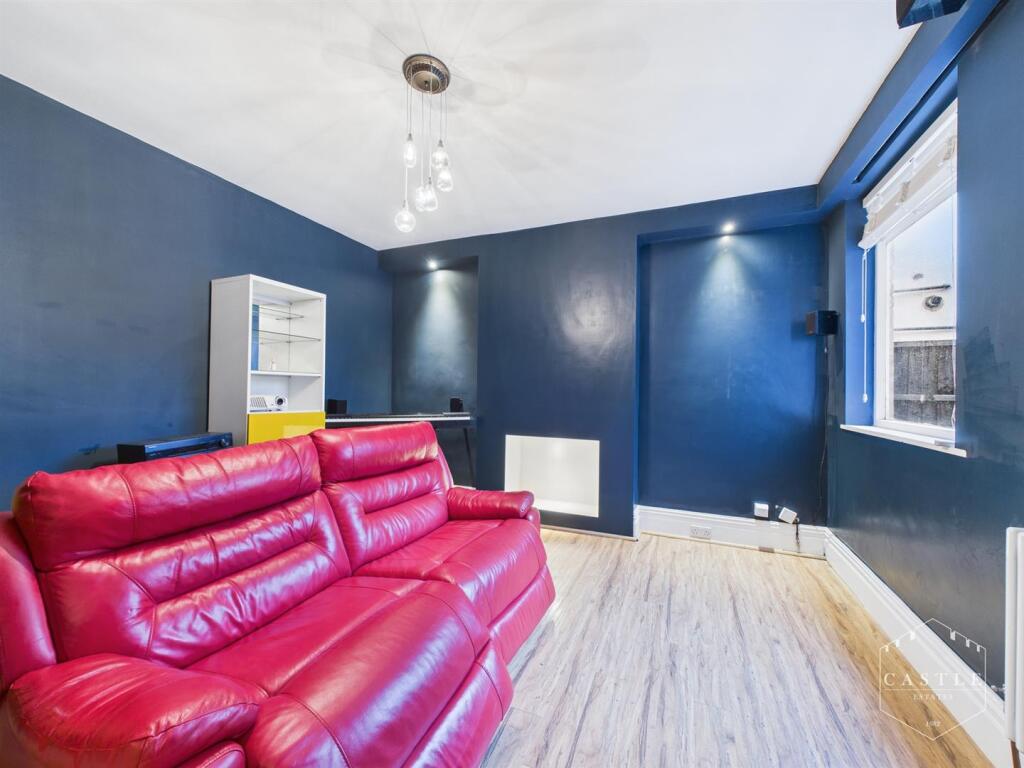 Open image 11 from listing 170637806
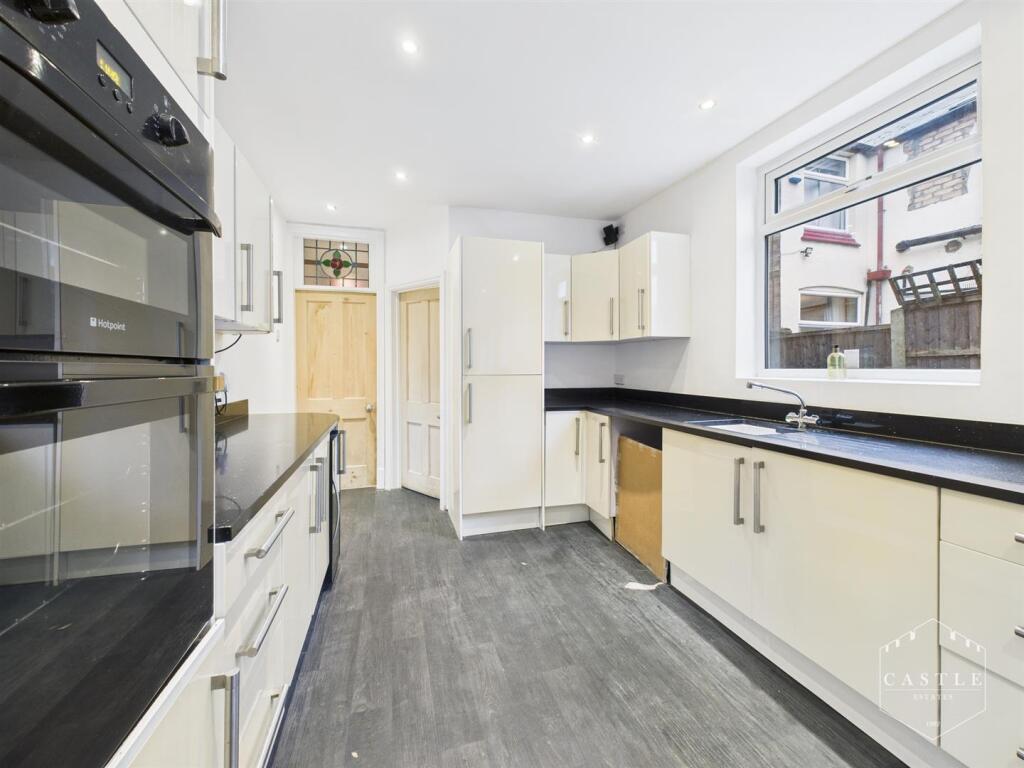 Open image 12 from listing 170637806
Sold comparables
Same street and nearby sales within 0.25 miles (last 5 years). Land Registry Price Paid Data.
| Address | Price | Date | Type |
|---|---|---|---|
| 64 MOUNT ROAD, HINCKLEY, HINCKLEY AND BOSWORTH, LEICESTERSHIRE, LE10 1AF | £375,000 | 12/09/2025 | Semi-detached |
| 10 PRIESTHILLS ROAD, HINCKLEY, HINCKLEY AND BOSWORTH, LEICESTERSHIRE, LE10 1AJ | £275,000 | 23/11/2023 | Semi-detached |
| 12 MOUNT ROAD, HINCKLEY, HINCKLEY AND BOSWORTH, LEICESTERSHIRE, LE10 1AF | £357,500 | 04/11/2022 | Semi-detached |
Area average: £335,833 (3 sales)
For sale comparables
No active for-sale comparables found within 1 mile for the same bedrooms and property type.
Capital growth trend
Land Registry outcode average: last 12 months vs 5y and 10y ago (from sold prices).
House Price Index (HM Land Registry — official index, not sold-price averages): Hinckley and Bosworth. Series: Semi-detached. As of July 2026.
Rental Range
Estimated market rent for Hinckley and Bosworth. Low = conservative, Realistic = average, Optimistic = best case.
Based on Local Authority from postcode lookup → Hinckley and Bosworth.
LHA (30th percentile) floor for Leicester: Apr 2025 – Mar 2026
Rental Comparables
Residential lets in the area (all bedroom counts shown — none matched the 4-bedroom count for this property). Student lets are excluded.
| Title | Rent | Beds | Distance | As seen on |
|---|---|---|---|---|
| 1 Bed Flat, Willowbank Close, LE10 | £1,950/mo | 1 | 0.32 miles | OpenRent |
| 2 Bed Flat, London Road, LE10 | £650/mo | 2 | 0.53 miles | OpenRent |
Average rent: £1,300/mo (2 listings)
Rent-driven metrics
Based on OpenRent comparables.
- Rent ratio — Monthly rent ÷ purchase price (1% rule). 1%+ = strong, 0.8–1% = okay, <0.8% = weak for cashflow.
- Max investor price — Rent ÷ 0.8%; the price at which rent would be 0.8% of price (Stoke-style target).
- Target investor price — Rent ÷ 1%; the price at which rent would be 1% of price (strong cashflow band).
- Gross yield — Annual rent as % of purchase price (no costs).
- Cost-to-rent — Price ÷ annual rent (from OpenRent comparables). Under 14× = strong, 14–16× = acceptable, 17×+ = compressed.
- Cashflow — Rent minus mortgage, 10% maintenance, £25/mo compliance. Assumes 75% LTV, 3.95% APR (5yr fixed), 25yr term.
- ROI — Annual profit ÷ cash in (deposit + 4% purchase costs).
Flood risk
Zone: 1
Risk: Low
Not in Flood Risk Area (no data)
Registered land (INSPIRE)
This location falls inside an HM Land Registry INSPIRE registered freehold polygon.
Plot: ~256 m² (0.06 acres)
Source: HM Land Registry INSPIRE Index Polygons.
Street-level crime
| Category | Count |
|---|---|
| Violence and sexual offences | 69 |
| Anti-social behaviour | 48 |
| Shoplifting | 43 |
| Criminal damage and arson | 22 |
| Public order | 19 |
| Other theft | 12 |
| Drugs | 10 |
| Vehicle crime | 6 |
| Burglary | 5 |
| Other crime | 5 |
| Bicycle theft | 2 |
| Possession of weapons | 1 |
| Robbery | 1 |
| Theft from the person | 1 |
| Total incidents | 244 |
Within 1 mile during Aug 2026. Source: data.police.uk (England & Wales).
Schools nearby
Nearest open schools with Ofsted ratings (England). Closed schools are not shown. Data from Get Information about Schools and Ofsted.
| Name | Type | Distance | Ofsted |
|---|---|---|---|
| R.E.A.L Independent Schools Hinckley | Other | 0.1 miles | Good — 14 Nov 2021 |
| St Mary's Church of England Primary School, Hinckley | Primary | 0.1 miles | Good — 3 Oct 2023 |
| Saint Peter's Catholic Primary School, A Voluntary Academy | Primary | 0.3 miles | Good — 11 Jun 2013 |
| Westfield Junior School | Primary | 0.6 miles | Requires improvement — 5 Dec 2022 |
| Hinckley Parks Primary School | Primary | 0.6 miles | Good — 4 Sep 2014 |
FENSA
FENSA certificate details will appear here after the next background check. If nothing changes after a few minutes, try refreshing the page.